Market Insights: Second Quarter Wrap-up
Milestone Wealth Management Ltd. - Jul 12, 2024
*For PDF version, please click here*

Key Updates on the Economy & Markets
The topic of interest rate cuts continues to dominate the financial markets. Investors are focused on when the U.S. Federal Reserve (Fed) will lower rates, all while keeping a close eye on corporate earnings and valuations. Economists are analyzing inflation and labor market data to determine their impact on the probability and timing of rate cuts. Speeches by Fed members and minutes of recent Fed meetings have received greater scrutiny as investors search for clues about the central bank's next steps. This letter recaps the second quarter, discusses investors’ focus on the Fed, and looks ahead to the remainder of 2024.
Global Central Banks are Starting to Cut Rates
While the Fed waits for more confirmation that U.S. inflation will return to target, the trend among global central banks has shifted decisively away from tightening. Figure 1 categorizes over 30 of the largest central banks based on whether their last policy action was a rate hike or a rate cut. The line shows the net number of central banks tightening versus easing. When the line is positive, it indicates more banks are raising interest rates. When it’s negative, it indicates more banks are cutting interest rates.
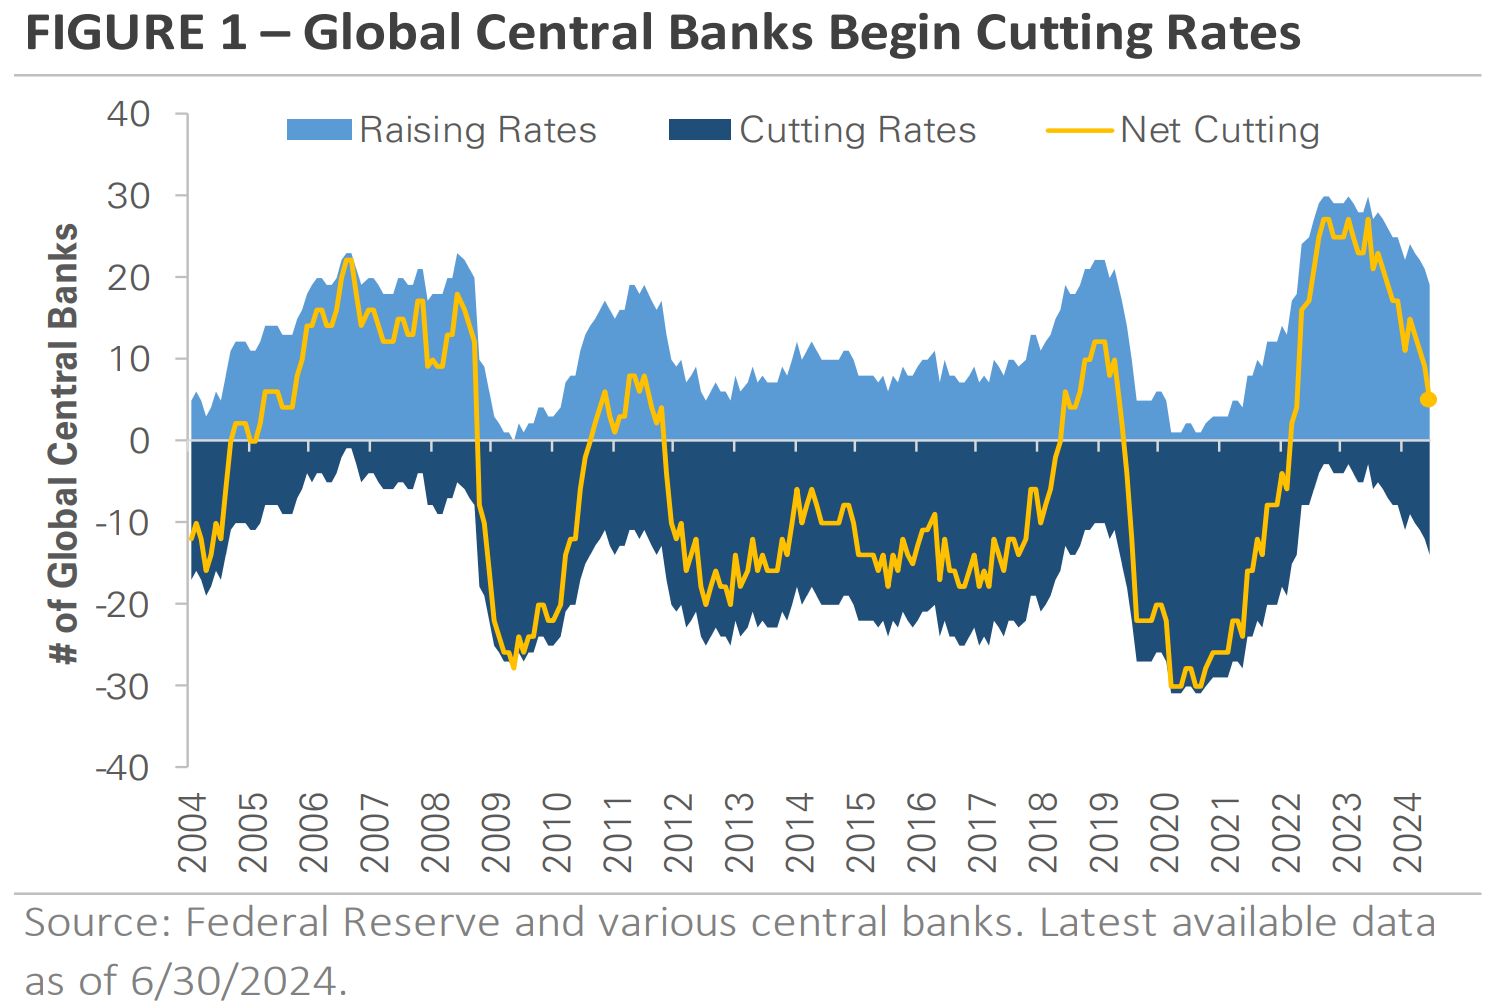
Central banks cut interest rates early in the pandemic to protect against unknown risks associated with shutting down the economy. When the economy reopened and inflation soared to multi-decade highs, they reversed course and raised interest rates with the goal of easing inflation. Central bankers kept interest rates high over the past few years while waiting for inflation to slow, as shown in the plateau from 2022 into 2023.
Today, central banks are starting to cut interest rates as inflation slows around the world. More than 10 central banks have cut rates, including here in Canada, as well as Switzerland and the European Central Bank. The monetary policy environment is shifting from rate hikes to rate cuts, and investors expect this trend to strengthen in the coming quarters as more banks cut interest rates. However, this easing cycle is likely to be more staggered than previous cycles, with central banks cutting interest rates at varying speeds based on their unique inflation and economic growth conditions.
Analyzing Economic Trends & Surprises From 2Q24
A big theme from the past few years has been the U.S. economy’s strength compared to the rest of the world. U.S. homeowners locked in low mortgage rates during the pandemic, which has protected them from the immediate impact of higher rates. However, mortgage rates reset more frequently in many countries outside the U.S. Such is the case in Canada, with borrowers here starting to feel the effect of higher rates sooner.
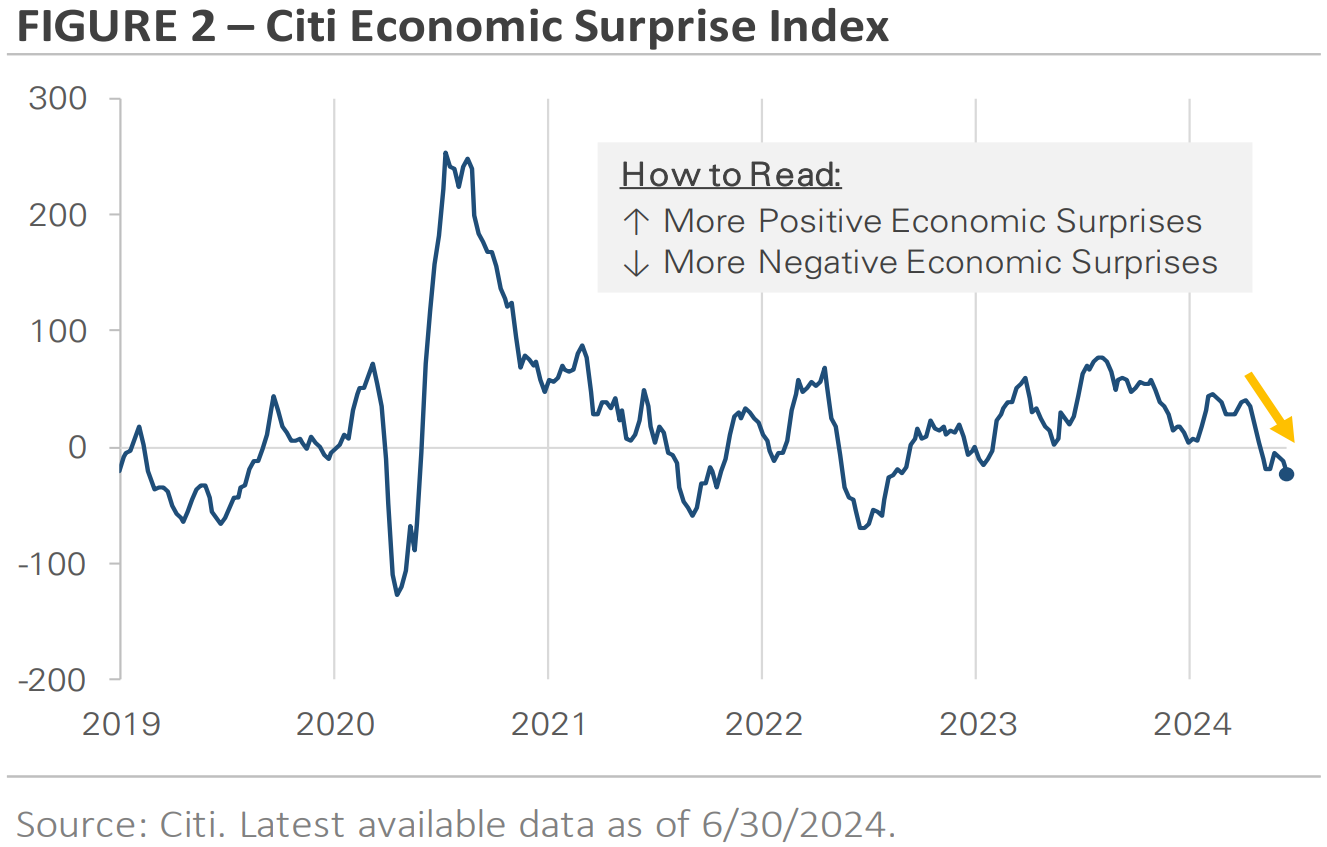
Figure 2 shows the Citi Economic Surprise Index, which compares economic data releases against Wall Street’s estimates. A positive reading indicates economic data is stronger than anticipated (positive surprises), while a negative reading signals more negative surprises. In March 2022, the index turned negative as the Fed started to raise interest rates. The increase in negative surprises signaled a slowdown in response to early rate hikes. During the past two years, the index stayed mostly positive as the economy remained resilient, with most economic data points surpassing expectations.
In Q2, there was an increase in the number of negative economic surprises as the U.S. economy underperformed expectations. Job growth slowed in April, and the unemployment rate rose to 4% in May from a 70-year low of 3.4% in April 2023. Keep in mind that 4% is still a low rate, historically. Retail sales declined in April, raising concerns about the U.S. consumer's strength and potential stress for lower-income households. May manufacturing survey data signaled a slowdown, and the U.S. Census Bureau reported that the economy grew more slowly in the first quarter than initially estimated.
Investors are debating what the recent negative surprises indicate. Are they the start of a new trend toward slower economic growth? If so, how much could the economy slow? Markets will closely monitor economic data in the third quarter. However, there isn’t a clear relationship between negative surprises and the rate of economic growth. Instead, the index is more of a reflection of how the economy is performing relative to investor expectations. The more appropriate question may be whether the U.S. economy is returning to its pre-pandemic trend after growing at an above-average rate over the past few years. If so, investors may need to adjust their expectations to match the economy’s new equilibrium.
Investors Remain Intently Focused on the Federal Reserve’s Next Interest Rate Decision
The market remained focused on the Fed’s policy guidance in the second quarter as inflation eased and economic data softened. However, there was no major shift in expectations, and investors still expect a rate cut later this year. Here in Canada, we have already had one quarter point cut. While the market is closely monitoring the Fed, it’s not receiving much actual guidance. On one hand, members of the Fed have advocated for patience. They want more confirmation that inflation is moving toward the 2% target. At the same time, those members, including Chair Jerome Powell, have said there is a high bar for additional rate hikes. Due to the unclear commentary, the market is left to speculate about the Fed’s next step. Investors are using monthly economic data to form their opinions. However, those data points can be noisy from month to month, as they are adjusted to account for seasonal economic effects like summer vacations and holiday shopping.
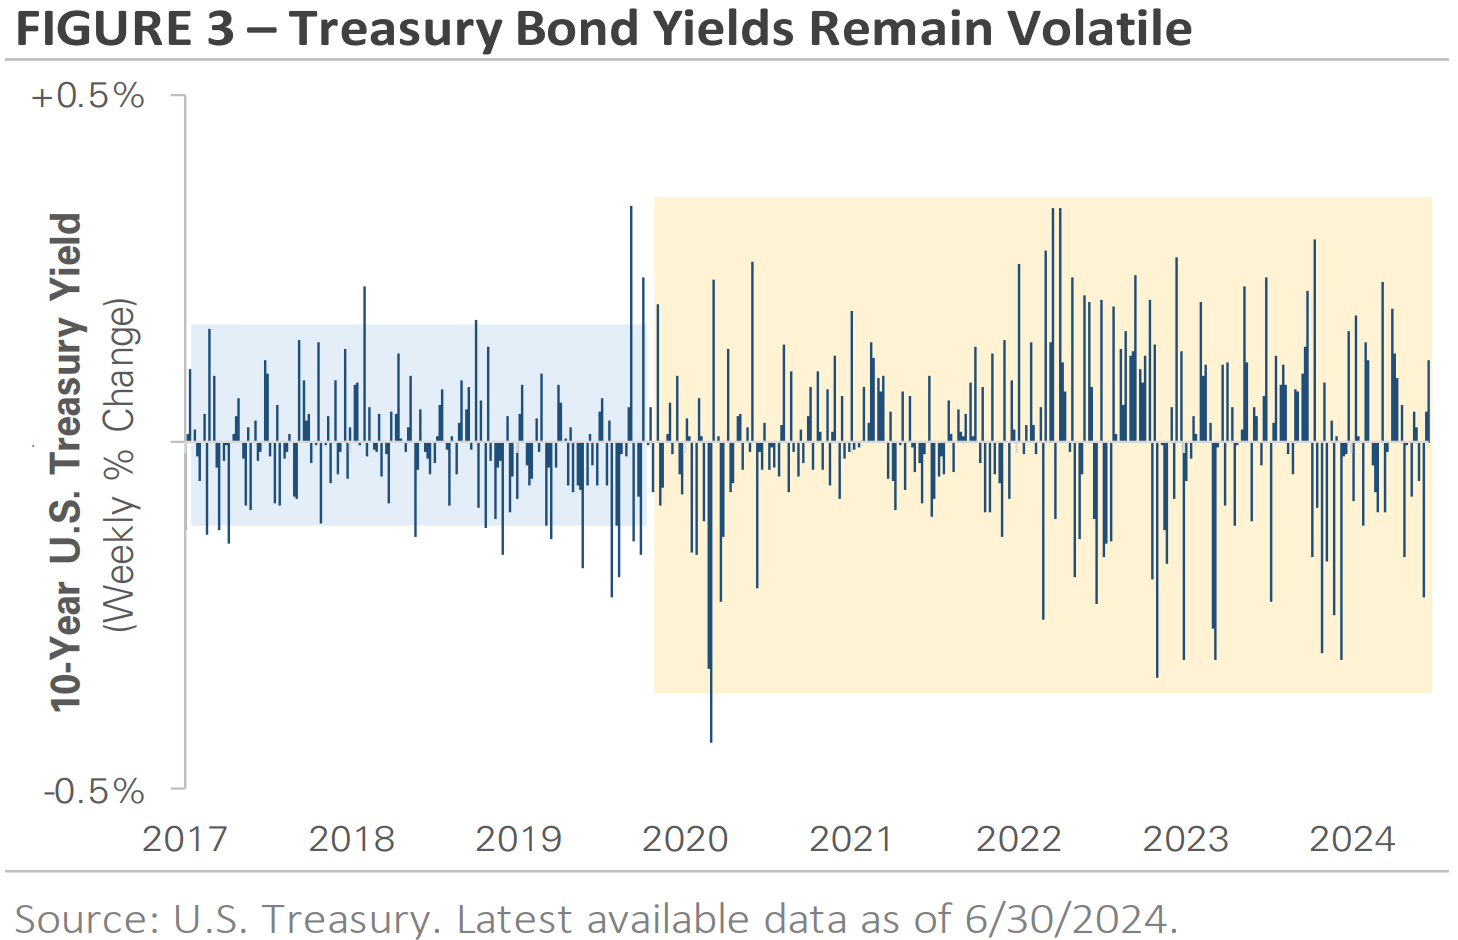
Bond yield movements show the data’s volatility and the market's indecisiveness. Figure 3 graphs the weekly changes in the 10-year Treasury bond yield over the past eight years. From 2016 to 2020, the 10-year yield’s movements were relatively small. The large drops near the middle of the chart mark the onset of the COVID pandemic and the Fed’s decision to slash interest rates to near zero. The right side of the chart shows that yields have been more volatile in both directions since the Fed began raising interest rates in March 2022. Today, Treasury yields are the most volatile they have been in eight years as the market navigates a complex transition from rate hikes to rate cuts.
Equity Market Recap – Stocks Rebound After April Sell Off, With Large Caps Leading the Way
The stock market experienced ups and downs this quarter. In April, stocks traded lower, reversing some of the earlier gains from Q1. In May, stocks rebounded, and the S&P 500 Index finished the quarter by setting multiple new all-time highs. Four S&P 500 sectors traded higher in Q2, while the remaining seven traded lower. Technology’s +8.8% gain made it the top-performing sector, with Communication Services gaining +5.2% and Utilities returning +4.6%. In contrast, cyclical sectors underperformed, with Materials, Industrials, Energy, and Financials being the four biggest underperformers.
One notable theme in the stock market this year has been the outperformance of the largest companies (all Tech). The S&P 500 Index increased +4.4% total return in Q2, increasing its 2024 return to more than +15%. In contrast, the Russell 2000 Index of small cap companies fell by -3.3%, lowering its 2024 total return to +1.6%. Figure 4 shows that this gap between large and small stocks is evident across equity indices, regardless of market cap. It graphs the year-to-date price returns of seven ETFs with varying exposures to companies of all sizes.
The divergence is so great that approximately 60% of the S&P 500’s gains for the year have come from just five “megacap” companies – Nvidia, Microsoft, Amazon, Meta and Apple. Nvidia alone accounted for 31% of the market’s first half advance, an incredible statistic.
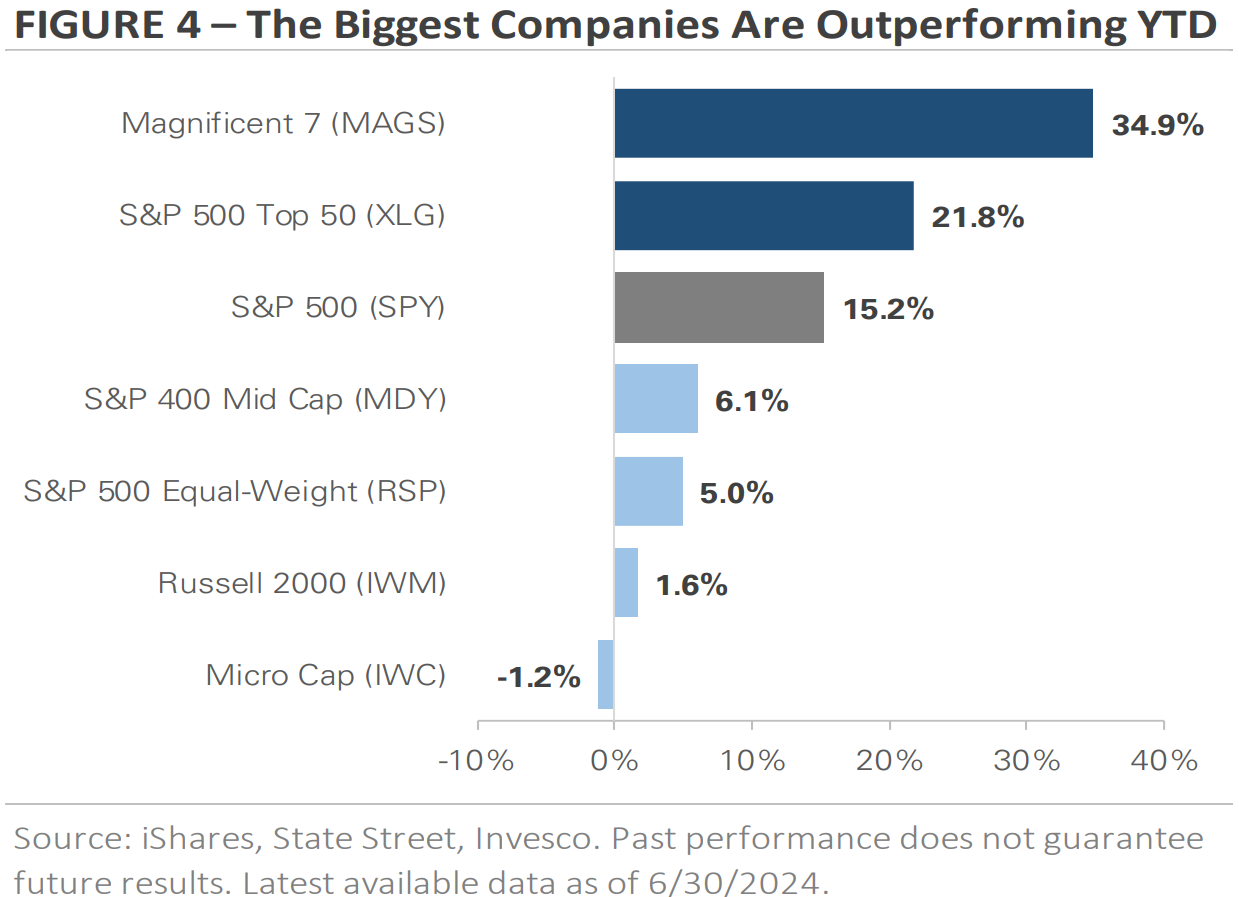
The ‘Magnificent 7’, which is a group that includes the previously mentioned names plus Alphabet and Tesla, has returned +34.9% this year. Expanding to the top 50 S&P 500 stocks reduces the return to +21.8%. Including the remaining S&P 500 companies, which are smaller in market cap, reduces the S&P 500’s return to +15.2%. The equal-weighted S&P 500 Index, where companies are weighted the same rather than by market cap, lowers the return to +5.0%. Mid-cap stocks have returned +6.1%, while small and micro caps have muted returns. The chart demonstrates the impact that market cap has had on 2024 equity returns, with returns decreasing as smaller companies are added. Investors appear to favor larger companies as they await clarity on Fed policy and the economy.
International stocks underperformed U.S. stocks in Q2, but performance (in USD) was mixed. The MSCI Emerging Market Index gained +4.4%, comparable to the S&P 500’s return. However, the MSCI EAFE Index of developed market stocks returned -0.2%. The two main international stock market indices have underperformed U.S. stocks by almost -10% this year, despite mid-single-digit YTD gains. The difference in returns continues to be a lack of exposure to companies in the artificial intelligence industry outside the U.S.
Here in Canada, similar to international indices with a much lower technology sector weighting than in the U.S., the S&P/TSX Composite managed a 6.1% total return at mid-year.
Credit Market Recap – Bonds End 2Q24 Flat Despite Volatile Treasury Yields
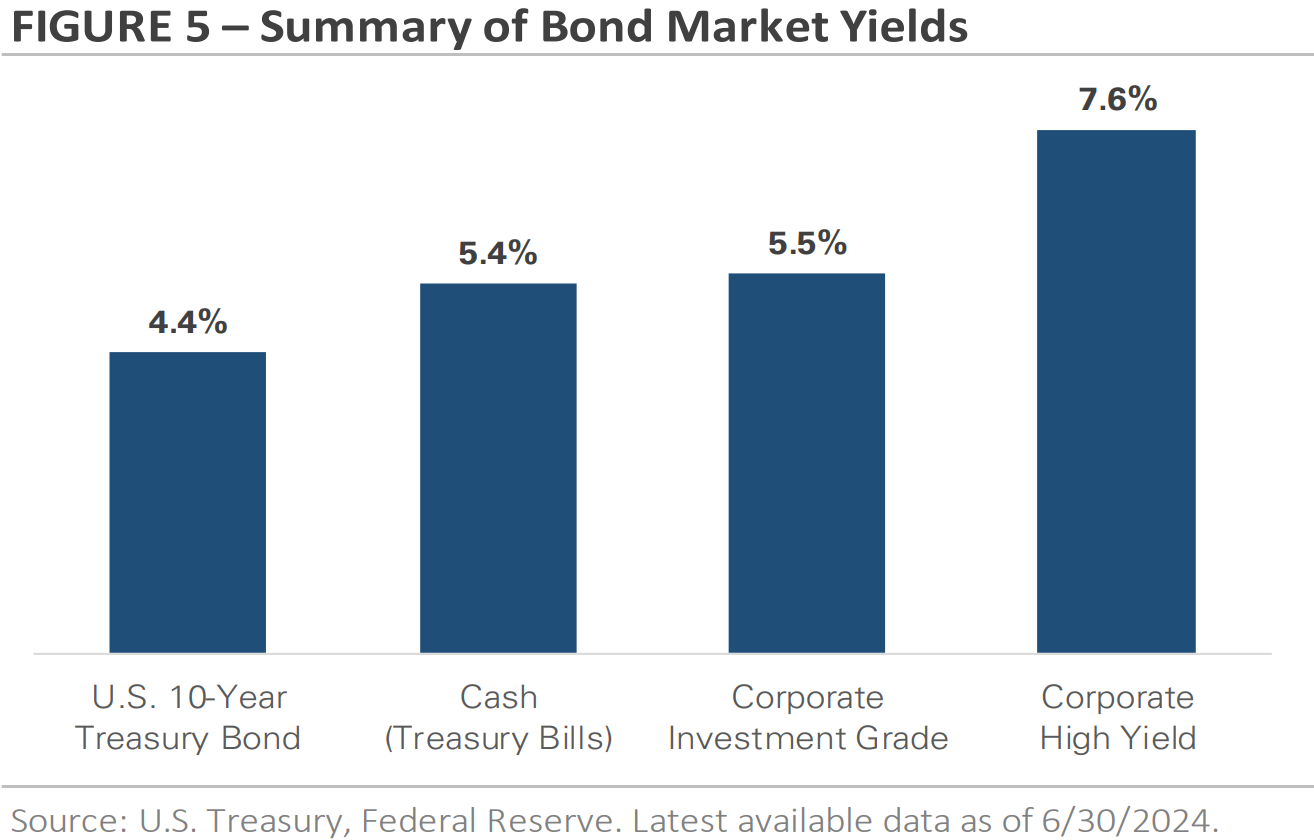
We previously highlighted the increased volatility of Treasury yields, and this volatility was on display in Q2. On the surface, yields ended the quarter marginally higher, but it was a bumpy ride. The 10-year U.S. Treasury yield started the quarter at 4.21%, rose to 4.70% by late April, and dropped back to 4.37% by the end of June. It is still up from 3.87% to start the year. Meanwhile here in Canada, our 10-year Government Bond Yield ticked up only slightly, ending the quarter at 3.51%, but up from 3.11% to start 2024. Despite the intra-quarter yield volatility, bonds overall posted relatively flat returns in the U.S. and marginally positive in Canada. The S&P Canada Aggregate Bond Index is now down 0.22% total return on the year, after a 1% increase in the second quarter. The S&P U.S. Aggregate Bond Index is down the exact same 0.22% YTD, but only up 0.34% in Q2. For Canadian investment-grade corporates, the index here is up 1.19% YTD total return. High yield U.S. bonds gained +0.7%, increasing its 2024 total return to +2.2%, while the S&P Canada High Yield Bond Index has been stronger, up 4.79% this year. Figure 5 shows that the big difference between the two corporate bond categories is their yield, with high yield offering more yield to compensate for its higher credit risk.
One theme supporting bonds is their relatively high-income level compared to the past fifteen years. Given the volatility of Treasury yields and expectations for rate cuts, we want to provide an update on what yield you might expect to earn today. Figure 5 shows the range of income opportunities available in the U.S. credit market. Treasury bills, which are a proxy for cash, offer a 5.4% yield, but this yield is expected to decrease as the Fed cuts interest rates. Rates are already a bit lower here in Canada after the recent rate cut. Locking in today’s yields for a longer period requires buying a 10-year U.S. Treasury bond yielding 4.4% (3.5% in Canada) or corporate investment grade yielding 5.5% (5% in Canada). Investors seeking a higher yield can buy corporate high yield, which yields 7.6% (6.7% in Canada), but it’s important to remember that these bonds have more credit risk.
Third Quarter Outlook – Themes to Watch
The stock market is off to a strong start this year, particularly in the U.S. when looking at their market-weighted large cap index. Economic data has softened, raising the question of whether the economy is slowing or simply returning to normal. Investors started this year expecting the Fed to cut interest rates in March; however, they are still waiting for their first interest rate cut.
The second half of 2024 will be busy. Investors expect the Fed to start cutting interest rates before year-end, but the projected timing of the first rate cut remains uncertain. The second-quarter earnings season starts in mid-July, which will provide an opportunity to hear updated commentaries from companies. There is a renewed focus on economic data and the economy’s trajectory, and the presidential election will take place in November. We will continue to monitor financial markets and the economy, provide timely updates to you, and adjust portfolios as needed.
Thank you for your continued trust in Milestone and for the opportunity to assist you in working toward your financial goals. We understand the risks facing both the markets and the economy and are committed to helping you effectively navigate this unique and at times challenging investment environment. Successful investing is a marathon, not a sprint, and even intense volatility is unlikely to alter a diversified approach set up to meet your long-term investment goals. Therefore, it’s critical to stay invested, remain patient, and stick to the plan, as we’ve worked with you to establish a unique, personal allocation target based on your financial position, risk tolerance, and investment timeline.
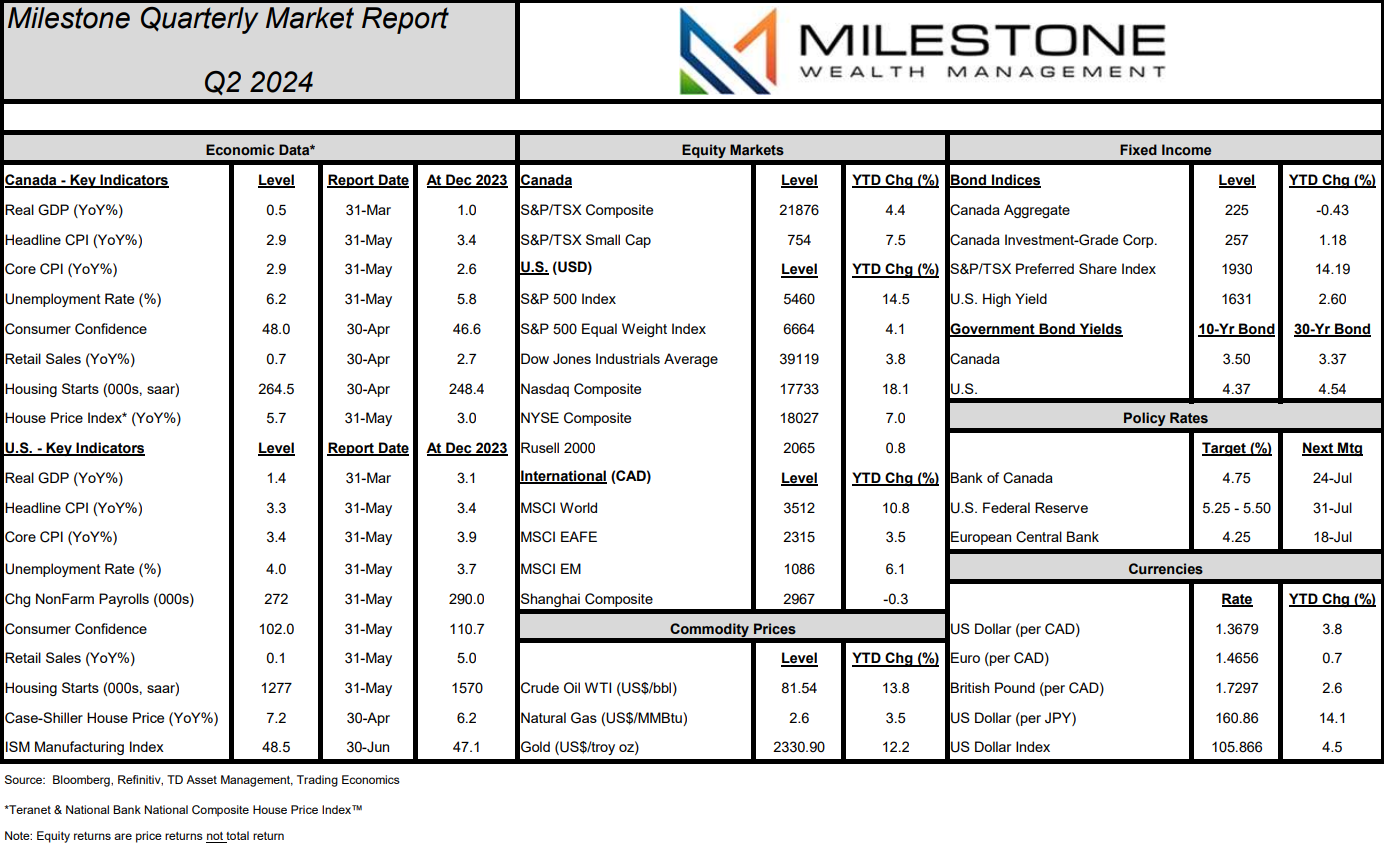
Here is our quarterly Market Report on economic data, capital markets, commodities, and currencies through June 28th, 2024:
*Click image for full PDF*
Disclosure:
Investing in equities is not guaranteed, values change frequently, and past performance is not necessarily an indicator of future performance. Investors cannot invest directly in an index. Index returns do not reflect any fees, expenses, or sales charges. Opinions and estimates are written as of the date of this report and may change without notice. Any commentaries, reports or other content are provided for your information only and are not considered investment advice. Readers should not act on this information without first consulting Milestone, their investment advisor, tax advisor, financial planner, or lawyer. This communication is intended for Canadian residents only and does not constitute as an offer or solicitation by anyone in any jurisdiction in which such an offer is not allowed.
Sources: Bloomberg, Refinitiv, TD Asset Management, Trading Economics, Teranet and National Bank of Canada, Barchart, MarketDesk Research LLC, Standard & Poors, MSCI, Dow Jones, Federal Reserve and various Central Banks, Citi, U.S. Treasury, iShares, State Street, Invesco
©2024 Milestone Wealth Management Ltd. All rights reserved.