Market Insights: Historic Rallies
Milestone Wealth Management Ltd. - Jun 13, 2025
Macroeconomic and Market Developments:
- North American markets were mixed this week. In Canada, the S&P/TSX Composite Index nudged up 0.28%. In the U.S., the Dow Jones Industrial Average fell 1.32% & the S&P 500 Index was down 0.39%.
- The Canadian dollar was up this week, closing at 73.59 cents vs 73.02 cents USD last week.
- Oil prices spiked with U.S. West Texas crude closing at US$73.60 vs US$64.63 last week (read more on that below).
- The price of gold jumped this week, closing at US$3,450 vs US$3,334 last week.
- Oil prices surged over 7% and the Dow dropped closed to 800 points Friday amid fears that Israel’s strikes on the Iranian military and nuclear sites could disrupt global crude supply, especially through the vital Strait of Hormuz. The S&P 500 and Nasdaq also fell, while energy stocks like Exxon and defense names like Lockheed rose. Cruise lines and airlines slumped on demand fears. Treasury yields jumped on inflation concerns, with sentiment lifted only slightly by a consumer confidence rebound following Trump’s temporary tariff pause.
- U.S. CPI rose just 0.1% in May (2.4% YoY), below expectations, with core CPI also up 0.1% (2.8% YoY). Food prices rose 0.3% while energy fell 1.0%, driven by lower gasoline prices. Real wages improved, with average hourly earnings up 0.3% in May and 1.4% YoY. Supercore inflation — closely watched by the Fed — has cooled to a 0.1% annualized rate over the past three months. The report bolsters the case for rate cuts later this year amid continued disinflation and flat money supply growth.
- Florida’s condo market is slumping, with sales down 13% over three months and inventories up 35% YoY. Canadians — who make up over a quarter of Florida’s foreign buyers — are increasingly listing properties due to rising costs, regulatory burdens, and political tension, including new travel rules. Insurance premiums, HOA fees, and required inspections on aging buildings are pushing some to sell even at a loss. A rebound isn’t expected until at least late 2026.
- Condo markets in Toronto and Vancouver are under severe pressure, with sales down 75% and 37% respectively since 2022, and prices falling 13.4% in Toronto and 2.7% in Vancouver. CMHC warns that surging inventories and slumping demand threaten future housing supply as project cancellations rise and developers pull back. Buyer sentiment is at 20-year lows, many pre-construction units remain unsold, and some investors now face significant capital losses. While the downturn brings short-term relief for renters and buyers, CMHC cautions it may worsen Canada’s long-term housing shortage.
- Roots reported a Q1 loss of $7.9M (20¢/share), narrowing from last year’s $8.9M loss, as sales rose 6.7% to $40M. Direct-to-consumer revenue grew 10% to $34.6M, with strong 14.1% same-store sales growth. CEO Meghan Roach said there’s been “no pullback” in consumer demand despite tariff-related headwinds. Wholesale and licensing revenue declined, and Roots continues to close underperforming stores and revamp others to boost traffic and deepen customer connection.
Weekly Diversion:
Check out this video: Furry Friends
Charts of the Week:
The period from April 8th, 2025, to June 6th, 2025, saw the S&P 500 Index experience a dramatic rebound, rallying just over 20% from a 50-day low in less than two months, for the 11th such occurrence since 1945. This surge stands out as one of the strongest rallies off a 50-day low in the index’s history, rivaling those seen after major market crises such as the 2020 Covid crash and the 2009 Financial Crisis. The green line in the next chart highlights this dramatic move.
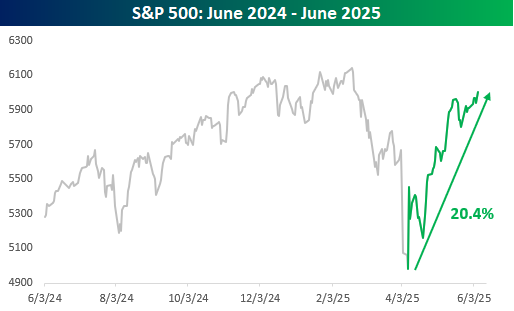
Source: Bespoke Investment Group
Historically, such sharp recoveries have produced mixed to negative short-term results, but strong medium- to longer-term gains. Analysis of previous instances where the S&P 500 rallied over 20% from a 50-day low in two months or less shows that, while returns over the following week and month were poor on average, the index was higher in every case after three, six, and twelve months, with an average one-year gain of 23.7% (more than double for all periods) as shown in the table below.
The current rally’s proximity to all-time highs is unusual, as most prior rallies of this magnitude occurred when the market was still significantly below its previous peak. This rare occurrence matches what has happened only three other times since 1945—specifically 1982, 1991, and 1998. The table highlights those three other years in light grey, all of them having very shallow maximum drawdowns over the following year.
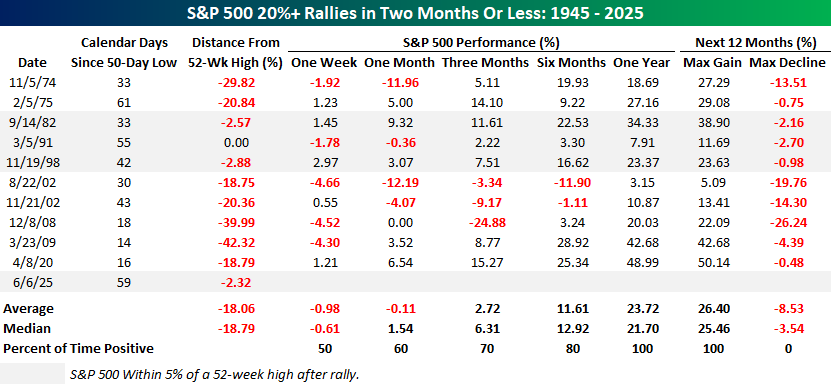
Source: Bespoke Investment Group
In addition, June 9th marked the two-month anniversary since the low, also rallying over 20%. As the following table shows, this is just the 6th such occurrence. There are less in this table than above because in some of those times when it rallied over 20% in less than two months, it then pulled back and didn’t stay up over 20% from the low after a two-month period. Therefore, this is an even rarer occurrence today. Looking specifically at these instances, the data further underscores the resilience of the market following these uniquely sharp rebounds. In the five prior cases since 1945, the S&P 500 posted even stronger results with forward returns three to five times larger than for all periods. Results were positive 100% of the time over one month to twelve months later, and the average forward return after a year was over 31%.
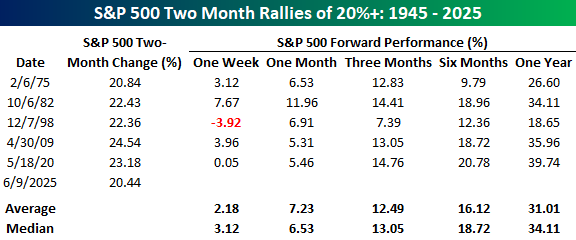
Source: Bespoke Investment Group
The current rally not only marks an historic recovery but also suggests a favorable outlook for the S&P 500 in the months ahead based on this data. As always, past results are not a guarantee of future performance.
Sources: Yahoo Finance, The Canadian Press, First Trust, The Globe & Mail, Bespoke Investment Group, The Financial Post
©2025 Milestone Wealth Management Ltd. All rights reserved.
DISCLAIMER: Investing in equities is not guaranteed, values change frequently, and past results are not necessarily an indicator of future performance. Investors cannot invest directly in an index. Index returns do not reflect any fees, expenses, or sales charges. Opinions and estimates are written as of the date of this report and may change without notice. Any commentaries, reports or other content are provided for your information only and are not considered investment advice. Readers should not act on this information without first consulting Milestone, their investment advisor, tax advisor, financial planner, or lawyer. This communication is intended for Canadian residents only and does not constitute as an offer or solicitation by anyone in any jurisdiction in which such an offer is not allowed.