Market Insights: Credit Spreads Contained, New Highs for Bitcoin
Milestone Wealth Management Ltd. - May 23, 2025
Macroeconomic and Market Developments:
- North American markets were down this week. In Canada, the S&P/TSX Composite Index barely moved, declining 0.35%. In the U.S., the Dow Jones Industrial Average was down 2.47% and the S&P 500 Index fell 2.61%.
- The Canadian dollar rose, closing at 72.84 cents vs 71.54 cents USD last week.
- Oil prices dropped a bit with U.S. West Texas crude closing at US$61.64 vs US$62.41 last week.
- The price of gold regained previous losses & more, closing at US$3,359 vs US$3,204 last week.
- Canadian retail sales rose 0.8% in March to $69.8B, beating expectations as auto sector strength led the rebound. New car sales jumped 5.2%, helping lift total retail volumes 0.9%. Core sales (excluding gas and autos) edged up 0.2%, with gains in building materials and apparel. Despite a 6.5% drop at gas stations, eight provinces posted gains, while Toronto lagged. Online sales slipped 2.1%. StatsCan’s early estimate for April points to a further 0.5% gain, suggesting underlying resilience despite trade-driven uncertainty.
- Canada’s headline inflation cooled to 1.7% in April, but rising core measures complicate the Bank of Canada’s June rate decision. While energy prices plunged and the removal of the federal carbon tax helped pull the CPI down from 2.3% in March, core inflation metrics—CPI median (3.2%) and CPI trim (3.1%)—rose to 13-month highs. The divergence between softening headline inflation and sticky core pressures, has lowered market odds of a June rate cut from 65% to 40%.
- Recession risks loom for Canada, TD’s chief economist expects any downturn to be moderate. Beata Caranci forecasts a potential loss of 100,000 jobs in the coming months—about 0.4% of the labour force—driven by front-loaded impacts from the U.S. trade war. While a technical recession may occur by Q3, TD anticipates a rebound in Q4 if federal stabilization efforts, such as the $2B “All in Canada” manufacturing initiative, gain traction.
- “Energy is Canada’s superpower,” declared new Energy Minister Tim Hodgson in Calgary, vowing federal support for infrastructure and innovation to strengthen Alberta’s global energy leadership. Hodgson called for finishing the Pathways carbon capture project and expanding investment into technologies like methane reduction and hydrogen to make Canadian oil and gas the most competitive and responsible globally.
- U.S. housing diverged in April. Existing home sales slipped 0.5% to a 4.00M pace, down 2.0% YoY, as affordability pressures and “mortgage lock-in” constrained listings. Inventory rose 20.8% YoY, pushing month's supply to 4.4, though still below a balanced market. The median price rose 1.8% to $414K, with activity skewed toward higher-end homes. In contrast, new home sales surged 10.9% to 743K — the strongest monthly gain in nearly two years — as builders offered incentives and smaller homes. Median new home prices fell 2.0% to $407K, with ample inventory supporting further momentum into 2025.
Weekly Diversion:
Check out this video: The Empire Strikes a Pose
Charts of the Week:
Last week, U.S. high yield corporate spreads tightened 152 basis points (bps) from April 7 to mid-May, moving from 461 to 309 bps above Treasuries, as shown in the chart below. One basis point is equivalent to 0.01%. High-yield credit spreads represent the difference in yield between high-yield (non-investment grade) corporate bonds and comparable U.S. Treasury bonds. These spreads are a key barometer for investor sentiment, credit risk, and the broader economic outlook.
Narrowing or falling high-yield spreads indicate that investors are more comfortable taking on risk, as they demand less extra yield for holding riskier bonds over safe-haven Treasuries. This tightening of spreads typically reflects optimism about the economy, with investors expecting stable corporate earnings and low default risks. Low spreads also suggest that credit markets (bloodline of the economy) are functioning well, liquidity is abundant, and companies with lower credit ratings can borrow at more favorable rates.
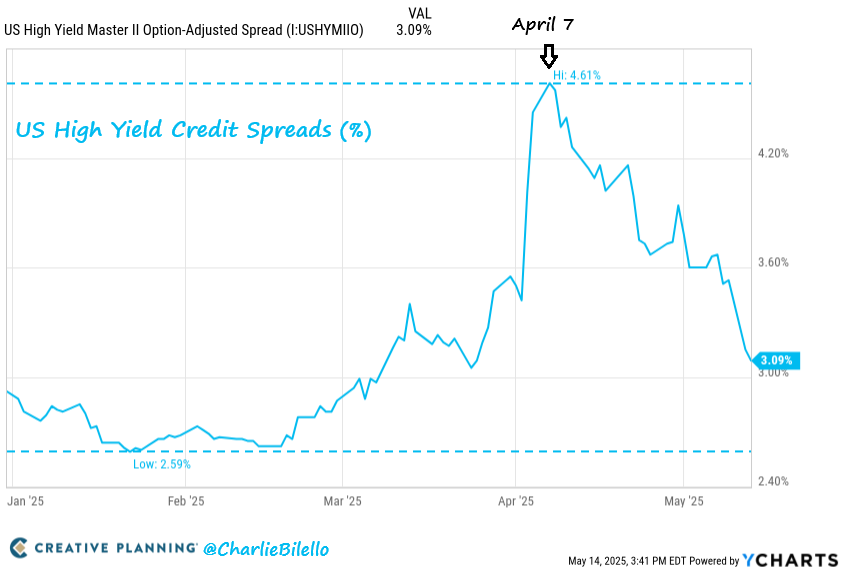
Source: YCharts, Creative Planning: @CharlieBilello
While we have seen long-term U.S. Treasury yields climb significantly recently, which may be a potential headwind for risk assets, credit markets are still indicating a lower risk of recession, or at minimum are not indicating any near-term systemic risk in credit markets as the next chart of the Chicago Fed National Conditions (NFCI) Credit Subindex highlights. The NFCI is a comprehensive weekly update from the Federal Reserve on U.S. financial conditions in money market, debt and equity markets, and the credit subindex is composed specifically of only measures on credit conditions. A value above or below zero implies tighter or looser than average credit conditions (i.e. lower number the better). However, based on historical precedence, only a reading above 0.5 has been considered severe and above 0.25 considered moderately at risk. Right now, it is not only negative at –0.035 (below average risk in credit markets), but it has also actually been declining since April 11th.
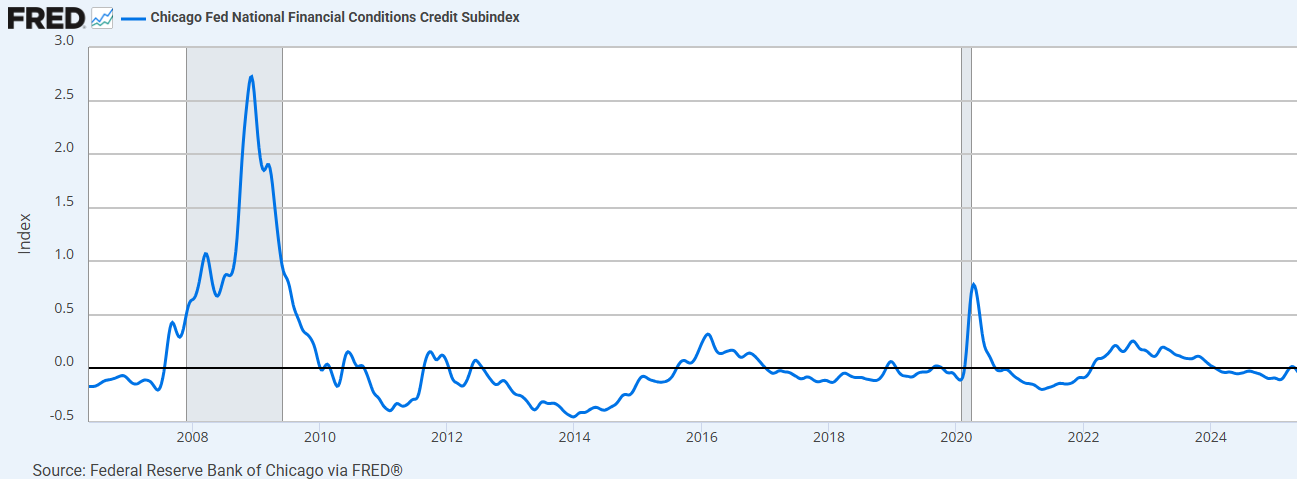
Source: Federal Reserve Bank of Chicago via Federal Reserve Economic Data (FRED®); shaded areas indicate U.S. recessions
In other news, Bitcoin has experienced significant volatility over the past year, marked by sharp declines and powerful rallies. As the next chart shows, after reaching a previous all-time high on January 20th (Inauguration Day), Bitcoin fell by 28% through April 8th. However, it then rallied by over 48%, climbing to new all-time highs above $111,000 USD this week, before pulling back slightly today.
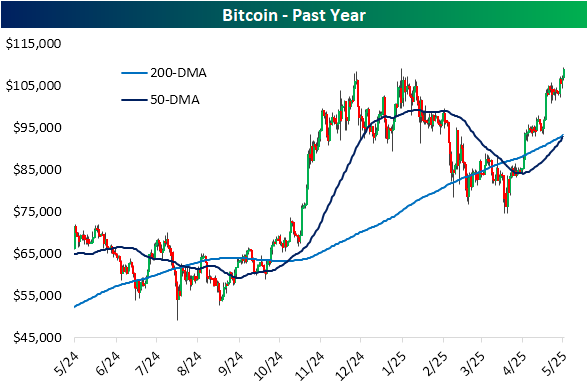
Source: Bespoke Investment Group
From a technical perspective, as the last chart below illustrates, Bitcoin's price action has closely mirrored the classic "cup-and-handle" pattern, a formation often associated with bullish continuation and major breakouts. This pattern, which has developed over several years, saw a breakout after the post-election rally, with the recent sell-off finding support just above that breakout level.
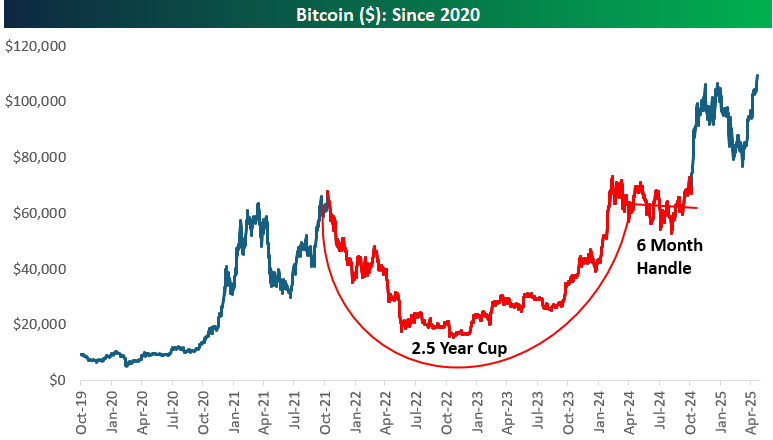
Source: Bespoke Investment Group
Sources: Yahoo Finance, Bloomberg, First Trust, Reuters, Global, YCharts, Creative Planning, @CharlieBilello, Bespoke Investment Group, Federal Reserve Bank of Chicago, Federal Reserve Economic Data (FRED)
©2025 Milestone Wealth Management Ltd. All rights reserved.
DISCLAIMER: Investing in equities is not guaranteed, values change frequently, and past performance is not necessarily an indicator of future performance. Investors cannot invest directly in an index. Index returns do not reflect any fees, expenses, or sales charges. Opinions and estimates are written as of the date of this report and may change without notice. Any commentaries, reports or other content are provided for your information only and are not considered investment advice. Readers should not act on this information without first consulting Milestone, their investment advisor, tax advisor, financial planner or lawyer. This communication is intended for Canadian residents only and does not constitute as an offer or solicitation by anyone in any jurisdiction in which such an offer is not allowed.