Market Insights: Another Positive Breadth Thrust
Milestone Wealth Management Ltd. - May 16, 2025
Macroeconomic and Market Developments:
- North American markets were up this week. In Canada, the S&P/TSX Composite Index rose 2.42% to hit a new all-time high. In the U.S., the Dow Jones Industrial Average was up 3.41 % and the S&P 500 Index increased 5.27%.
- The Canadian dollar dropped ever so slightly, closing at 71.54 cents vs 71.76 USD cents last week.
- Oil prices came up a bit as U.S. West Texas crude closed at US$62.41 vs US$60.95 last week.
- The price of gold dropped, closing at US$3,204 vs US$3,333 last week.
- April CPI rose 0.2%, bringing year-over-year inflation down to 2.3%, the lowest since early 2021; core CPI held at 2.8%, real wages were flat on the month but up 1.4% annually, and despite tariff concerns, goods prices like apparel and used cars declined—suggesting subdued pass-through and raising the odds for Fed rate cuts later in 2025.
- U.S. retail sales rose 0.1% in April (0.3% including revisions), hitting an all-time high, but gains were narrow and largely driven by restaurants and bars (+1.2%). “Core” sales (ex-autos, building materials, and gas) also edged up 0.1%. Real retail sales are up 2.8% year-over-year but remain below early 2021 peaks. While growth has moderated, momentum remains broadly positive as consumers adapt to shifting global trade dynamics.
- Canada's retaliatory tariffs on U.S. goods have been largely neutralized through broad exemptions on manufacturing inputs, health and safety items, and some vehicle imports — effectively reducing the overall tariff rate to “nearly zero,” according to Oxford Economics. While duties remain on select consumer goods like alcohol, coffee, and cosmetics, along with Aluminum and Steel, the Carney government’s strategic restraint is aimed at protecting domestic growth amid trade tensions.
- Enbridge has sold a 12.5% stake in its Westcoast natural gas pipeline system to 36 First Nations in B.C. for $715 million, marking one of the largest Indigenous equity partnerships in Canadian energy infrastructure. The Stonlasec8 Indigenous Alliance will benefit from sustained revenues to support housing, infrastructure, and cultural initiatives. The deal includes a $400 million federal loan guarantee and is expected to close by the end of Q2 2025.
- New Natural Resources Minister Tim Hodgson is being welcomed by Alberta’s energy sector as a pragmatic and experienced choice. With past roles at MEG Energy, Goldman Sachs, and Hydro One Industry leaders view his appointment as a possible “reset” in federal-provincial relations after years of tension under prior Liberal ministers. Alberta stakeholders hope his business background and ties to the oil patch signal Ottawa may now prioritize investment, regulatory reform, and major project approvals.
Weekly Diversion:
Check out this video: Highly Impressive baseball plays (I enjoyed #10)
Charts of the Week:
The 50-day and 200-day moving averages (-DMAs) are among the most closely watched technical indicators in financial markets, especially for major indices like the S&P 500. This week, the S&P 500 demonstrated notable strength, surging above its 200-DMA for the first time in over a month. Additionally, for the first time in over two months, both the 50-DMA and 200-DMA for the S&P 500 are now sloping upward, as shown in the first chart. This ended a streak of 56 trading days where both moving averages had been declining.
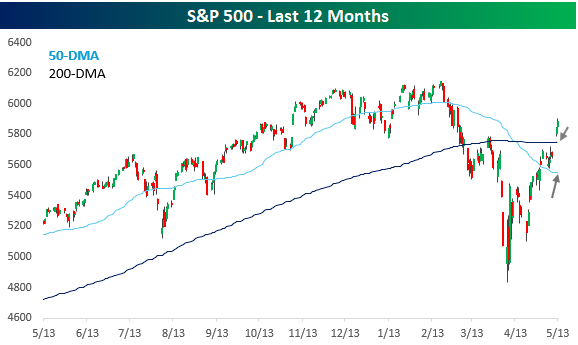
Source: Bespoke Investment Group
Historically, when the S&P 500 rallies at least 1% to cross above its 200-DMA after staying below it for at least a month, subsequent performance has been notably strong, as the next chart highlights. Since 1953, there have been 26 such instances. The median 1-year performance of the S&P 500 following these events is almost twice the average for all periods since 1953, posting median forward returns of 17.5% compared to all-periods at just 9.2%. The frequency of 1-year forward positive returns following this signal is also higher than average, at 88.5% vs. 73.9% for all periods. The three- and six-month forward returns have also been extremely strong compared to all periods.
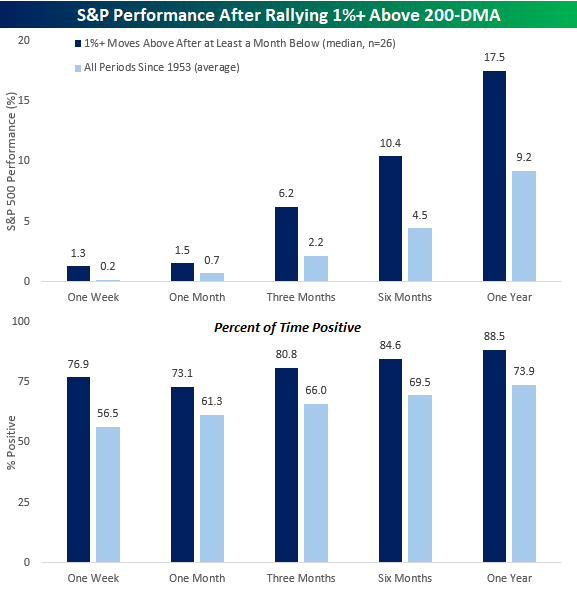
Source: Bespoke Investment Group
It has certainly been an impressive rally off the April 7th lows. For just the sixth time in the S&P 500’s history, it has soared at least 18% over just 25 trading days. As the next chart illustrates, the last five times this occurred, the average forward gain over the next 250 trading days (approximately one year) was 30%, with the lowest and best gains being 11.4% and 43.7%.
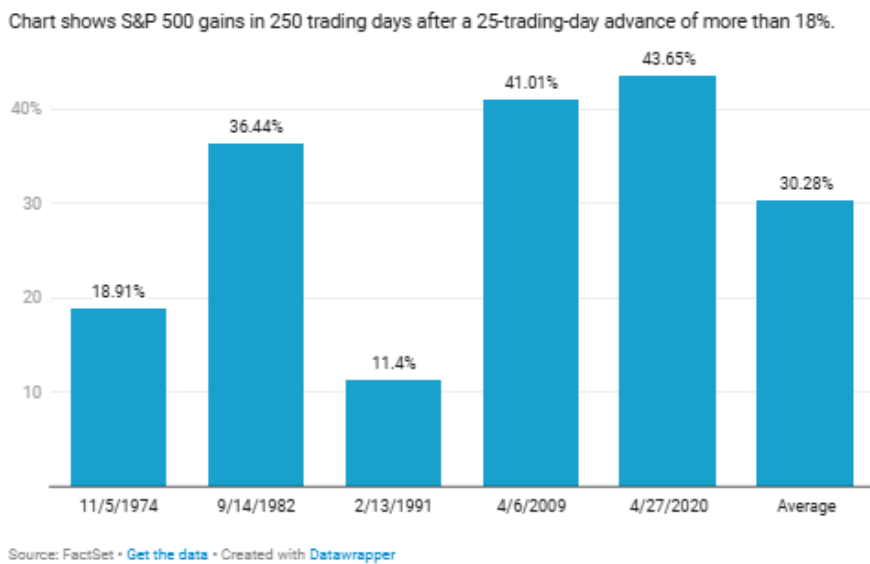
Source: Barchart
Interestingly this week, a lesser-known indicator was triggered in the DeGraaf Breadth Thrust, the first time since December 2023. The DeGraaf Breadth Thrust is a technical indicator used to identify bullish momentum shifts in the stock market, specifically focusing on the percentage of S&P 500 stocks hitting 20-day highs. The signal triggers when the percentage of S&P 500 stocks trading at 20-day highs spikes above 55% within a brief period. This rapid surge reflects a shift from weak to strong market participation, suggesting a potential new bullish phase. Since 1979, there have been 30 prior instances of this signal (a solid sample size), and as the last chart summarizes, one year later the average return for the S&P 500 was 15.5% with positive returns an impressive 97% of the time.
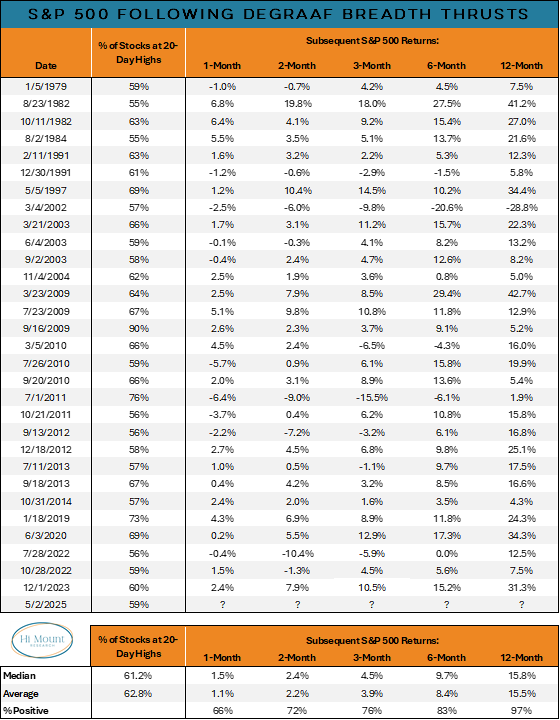
Source: Hi Mount Research, @WillieDelwiche
Sources: Yahoo finance, Bloomberg, First Trust, Financial Post, Bespoke Investment Group, Calgary Herald, Barchart, Hi Mount Research, @WillieDelwiche
©2025 Milestone Wealth Management Ltd. All rights reserved.
DISCLAIMER: Investing in equities is not guaranteed, values change frequently, and past performance is not necessarily an indicator of future performance. Investors cannot invest directly in an index. Index returns do not reflect any fees, expenses, or sales charges. Opinions and estimates are written as of the date of this report and may change without notice. Any commentaries, reports or other content are provided for your information only and are not considered investment advice. Readers should not act on this information without first consulting Milestone, their investment advisor, tax advisor, financial planner or lawyer. This communication is intended for Canadian residents only and does not constitute as an offer or solicitation by anyone in any jurisdiction in which such an offer is not allowed.