Market Insights: Market Volatility & Buying Opportunities
Milestone Wealth Management Ltd. - Apr 11, 2025
Macroeconomic and Market Developments:
- North American markets rebounded this week after sharp declines last week. In Canada, the S&P/TSX Composite Index rose 1.70%, after dropping 6.32% last week. In the U.S., the Dow Jones Industrial Average was up 4.95%, after falling 7.86% last week, and the S&P 500 Index jumped 5.70%, after falling 9.08% last week.
- The Canadian dollar jumped again this week, closing at 72.0 cents vs 71.02 cents last week. It is up over 3% in the last two weeks.
- Oil prices remained low and stagnant this week. U.S. West Texas crude closed at US$61.54 vs US$61.99 last week.
- The price of gold keeps rolling with another new all-time high this week, closing at US$3,249 vs US$3,012 last week.
- In the U.S. inflation cooled in March, with CPI falling 0.1% — the first decline since the pandemic — bringing annual inflation down to 2.4%. Core CPI rose just 0.1%, the slowest in six months, while “supercore” prices fell 0.2%. Despite tariff concerns, falling gas and travel prices drove the decline, raising the odds that the Fed may consider rate cuts in the months ahead.
- U.S. job growth surged in March, with nonfarm payrolls up 228,000 and “core” private sector hiring posting its most substantial gain in over a year. Wage growth remained steady (+0.3% MoM, +3.8% YoY), while the unemployment rate ticked up to 4.2% as more people entered the labor force. Federal job cuts under DOGE continued, and booming vehicle sales ahead of potential tariffs added to momentum — supporting a “wait-and-see” stance from the Fed.
- U.S. services sector growth slowed in March, with the ISM Non-Manufacturing Index falling to 50.8, well below expectations and signaling the weakest pace of expansion in nearly a year. Employment conditions deteriorated sharply, while new orders hovered just above contraction territory at 50.4.
- TD Bank remains under scrutiny for alleged money-laundering failures, with ongoing investigations in Canada and the U.S. reportedly tied to billions in suspicious transfers, some linked to drug trafficking networks. While TD has boosted compliance spending and pledged reforms, questions over reputational risk and regulatory fallout continue to weigh on investor confidence.
- Canadian pension funds are pivoting toward Europe as U.S. trade tensions escalate, with leaders like Ontario Teachers’ and UPP highlighting stronger European growth and less competition as drivers behind increased investment in European infrastructure, real estate, and private credit.
Weekly Diversion:
Check out this video: With the Master’s underway, take a moment to enjoy this
Charts of the Week:
The ongoing trade war including the reciprocal sweeping tariffs, the 90-day pause, and escalation of tariffs between China and the U.S. has led to significant volatility in the global markets. Staying invested during times of elevated volatility has time and time again proven to be the best strategy. However, for those looking to take advantage of compressed markets to invest new capital, it can be difficult to determine the best time to step in. When volatility and fear are present, patience and timing are important as these conditions often present historic buying opportunities for those willing take advantage before the recovery happens. Rather than attempting to "catch a falling knife" by buying during a steep correction, focusing on key technical indicators that have historically been strong entry point signals in the past is a better strategy.
One of these indicators is the percentage of S&P 1500 stocks trading above their 200-day moving average, as shown in the bottom half of the chart below. The S&P 1500 Index captures market participation across large-, mid-, and small-cap stocks, making it a reliable barometer for overall market health. A drop below 15% in this indicator signals a "washout," or extreme market pessimism, which serves as a cue to start monitoring. These are shown by the large green circles below, which just occurred this past Monday. This has only occurred over six periods of time in the past 20 years. The actionable trigger is when this percentage climbs back above 15%, which happened later this week, indicating a potential recovery and renewed investor confidence. The top chart shows these points in time (green dots) but on the chart of the S&P 500 Index. As you can see, this has been an extremely effective signal in the past. Only time will tell.
It is also important to note that recoveries can happen quickly or take time, sometimes even making another low along the way, requiring discipline and patience. By adhering to certain data-driven approaches, investors can help position themselves to capitalize on market recoveries while minimizing unnecessary risks.
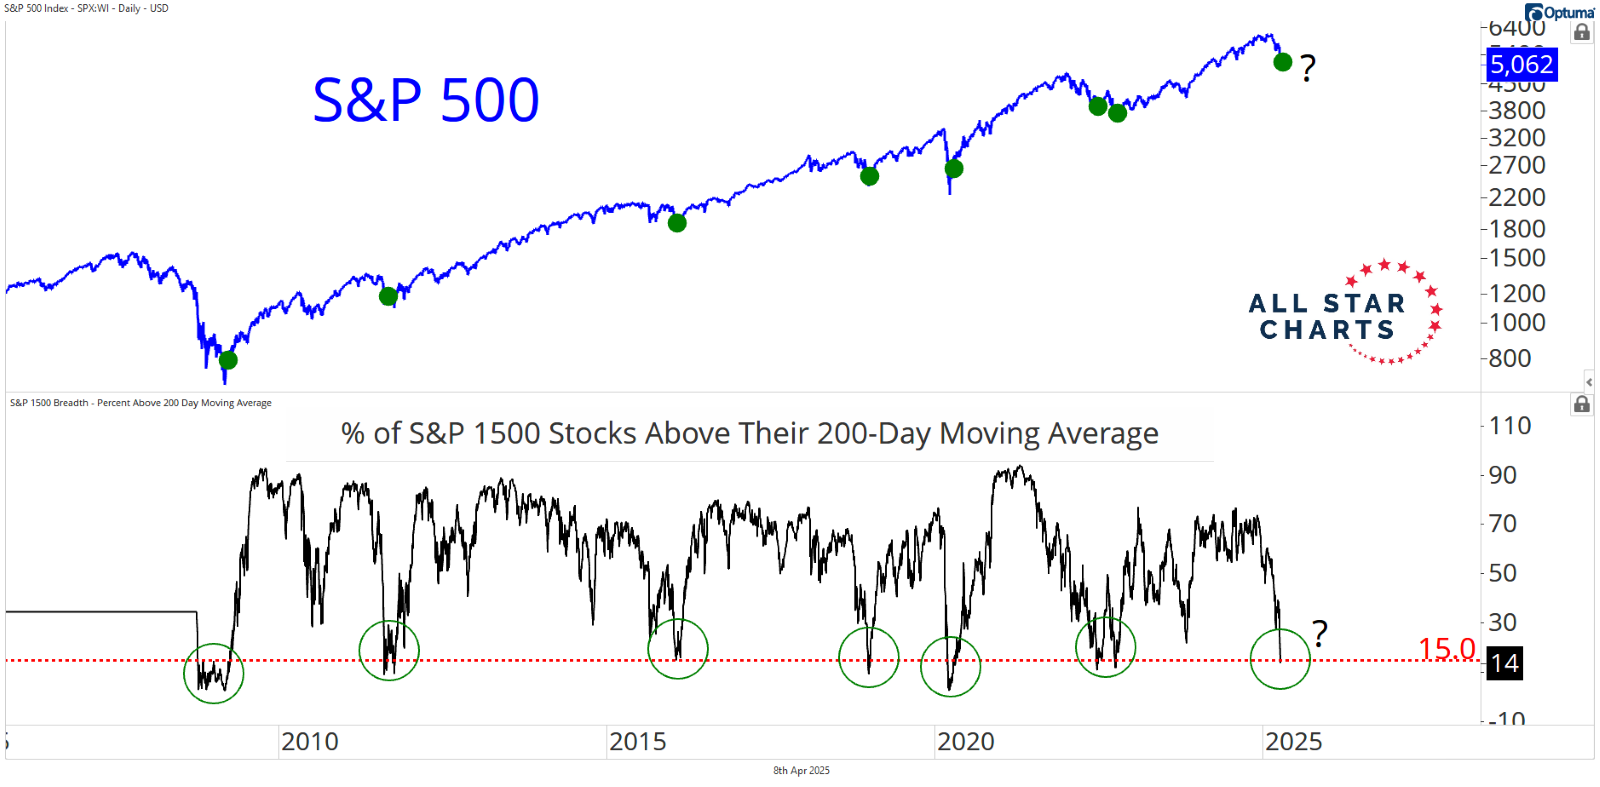
Source: The Chart Report, @AlfCharts
On Wednesday, Donald Trump announced a 90-day pause on his sweeping tariffs (except China), and the S&P 500 Index had a very large one-day reprieve, advancing 9.5%. Since 1970, the index has experienced 24 days where it gained at least 5% in a single session. Historically, such strong days are often followed by short-term declines, with the index averaging a 1.67% drop the next week and falling more than half the time. However, as we can see in the next table, longer-term performance after these days has been notably very positive on average. Over one-month to one-year, average forward returns have exceeded normal levels, especially after six months. Specifically, one-year forward returns have averaged almost 27% (median: 21.5%), with only two outlier instances of declines—January 2001 and September 2008. This suggests that while immediate strength may not persist, longer-term prospects remain favorable, especially as we are still currently in a secular bull market trend since 2013.

Source: Bespoke Investment Group
Sources: yahoo finance, First Trust, Bloomberg, The Chart Report, Financial Times, Bespoke Investment Group
©2025 Milestone Wealth Management Ltd. All rights reserved.
DISCLAIMER: Investing in equities is not guaranteed, values change frequently, and past performance is not necessarily an indicator of future performance. Investors cannot invest directly in an index. Index returns do not reflect any fees, expenses, or sales charges. Opinions and estimates are written as of the date of this report and may change without notice. Any commentaries, reports or other content are provided for your information only and are not considered investment advice. Readers should not act on this information without first consulting Milestone, their investment advisor, tax advisor, financial planner or lawyer. This communication is intended for Canadian residents only and does not constitute as an offer or solicitation by anyone in any jurisdiction in which such an offer is not allowed.