Market Insights: A Shift in Market Sentiment - Understanding the Rise in Bearish Outlook
Milestone Wealth Management Ltd. - Mar 28, 2025
Macroeconomic and Market Developments:
- North American markets were all down this week. In Canada, the S&P/TSX Composite Index fell 0.84%. In the U.S., the Dow Jones Industrial Average was down 0.96% and the S&P 500 Index was down 1.53%.
- The Canadian dollar was stagnant again this week, closing at 69.8 cents vs 69.7 cents last week.
- Oil prices rose this week. U.S. West Texas crude closed at US$69.11 vs US$68.28 last week.
- The price of gold keeps rolling, closing at US$3,114 vs US$3,021 last week.
- After 0.4% GDP growth in January, early data suggests the Canadian economy stalled in February, with economists warning that looming U.S. tariffs could drag growth into reverse. Analysts say the January boost may reflect businesses front-running tariffs, while confidence is already slipping among consumers and firms.
- Canada posted a C$26.85 billion deficit for the first ten months of fiscal 2024/25, slightly above last year’s shortfall, as program spending and debt charges outpaced revenue gains. While revenues grew 10.9%—driven by strong personal income tax receipts—higher outlays across most categories and a 16.2% jump in debt servicing costs widened the gap. The government ran a C$5.13 billion deficit in January alone, more than double the shortfall from a year earlier.
- As Trump’s 25% auto tariffs near implementation, Ontario Premier Doug Ford spoke directly with U.S. Commerce Secretary Howard Lutnick, gaining key insights on exemptions. According to Ford, Canadian vehicles with more than 50% U.S. parts will be fully exempt, while those with up to 50% American content will face a reduced 12.5% tariff. Auto parts crossing the border won’t be taxed until assembled into vehicles.
- The U.S. economy grew at a slightly stronger pace than initially estimated in Q4, with GDP revised up to 2.4%. While consumer spending was revised lower, gains in business investment, trade, and government spending helped offset the drag. More notably, economy-wide corporate profits jumped 5.4% on the quarter and 6.9% year-over-year, reflecting broad-based strength across sectors and supporting continued job growth into March.
- In the U.S. Personal income jumped 0.8% in February, driven largely by government transfers, such as premium tax credits and Social Security adjustments, while core inflation remained sticky at 2.8%. Real consumption growth was modest at just 0.1%, suggesting rising prices are eating into household purchasing power.
Weekly Diversion:
Check out this video: Phenomenal GoPro Footage
Charts of the Week:
In recent weeks, there has been a notable shift in market sentiment, with bullish optimism giving way to bearish concerns. This change is evident in various surveys, including those conducted by the American Association of Individual Investors (AAII) and Investors Intelligence, as well as the latest Consumer Confidence report from the Conference Board. The latter saw a significant decline in overall confidence, with the headline index dropping from 100.1 to 94.2.
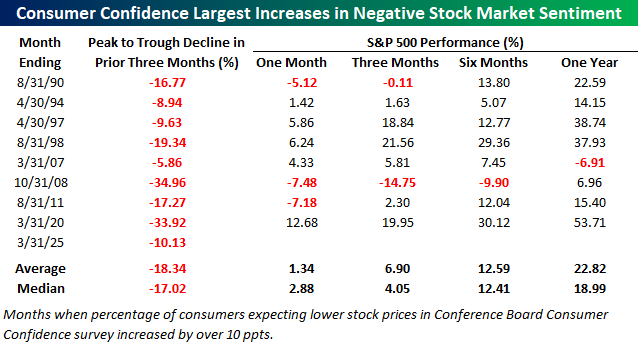
Since 1987, there have been only a few instances where negative sentiment has increased by ten or more percentage points in a month. These periods often followed market weakness and were typically near short-term lows. The chart below highlights these instances and the subsequent performance of the S&P 500 Index.

Source: Bespoke Investment Group
Historically, these surges in negative sentiment have often followed corrections and preceded market rebounds, as shown in the table below. In the months following such increases, the S&P 500 has shown a tendency to recover:
One Month Later: The S&P 500 was higher at least 60% of the time, with a median gain of 2.9%.
Three Months Later: The median gain increased to 4.1%, with the market still higher more than 60% of the time.
Six Months & One Year Later: The S&P 500 was higher seven out of eight times in both case, with very strong median gains of 12.4% and 19%, respectively.

Source: Bespoke Investment Group
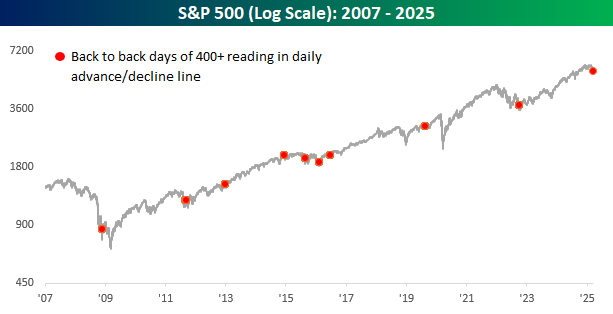
What is interesting to note during this market correction and rise in negative sentiment is that early last week, the S&P 500 had back-to-back positive all-or-nothing days. These days can be defined as a daily net advance/decline reading above or below 400. This seems to indicate some very strong underlying breadth to U.S. the stock market, notwithstanding some of the larger-cap tech companies’ recent declines.
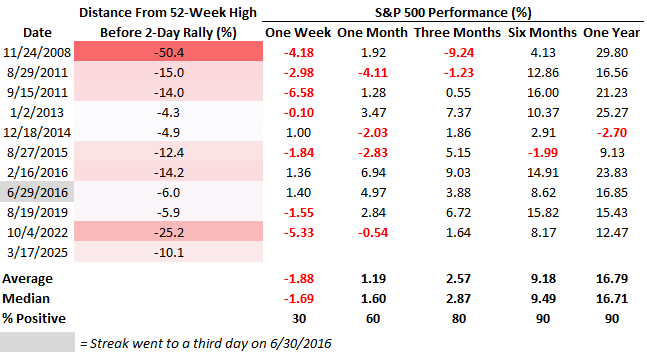
A back-to-back positive breadth reading of 400+ is a rare event, as can been seen by the red dots on this chart of the S&P 500 over the last 18 years (10 times). For the most part, this has occurred at or near intermediate or long-term lows. The table that follows this shows that while the S&P 500’s forward looking returns following these instances were volatile in the near-term and susceptible to some further declines, the six- and twelve-month returns averaged 9.2% and 16.8%, respectively, far exceeding average returns for all periods.


Source: Bespoke Investment Group
The current increase in bearish sentiment, while concerning, may signal a potential turning point for the market. Historically, such shifts have often been followed by rebounds, suggesting that investors might be building a "wall of worry" that the market can climb. However, it's crucial to note that past performance is not a guarantee of future results, and the range of returns can vary widely. As investors navigate these uncertain times, understanding historical trends can provide valuable insights into potential market movements.
Sources: Yahoo finance, First Trust, Bloomberg, The Toronto Sun, Reuters, Bespoke Investment Group
©2025 Milestone Wealth Management Ltd. All rights reserved.
DISCLAIMER: Investing in equities is not guaranteed, values change frequently, and past performance is not necessarily an indicator of future performance. Investors cannot invest directly in an index. Index returns do not reflect any fees, expenses, or sales charges. Opinions and estimates are written as of the date of this report and may change without notice. Any commentaries, reports or other content are provided for your information only and are not considered investment advice. Readers should not act on this information without first consulting Milestone, their investment advisor, tax advisor, financial planner or lawyer. This communication is intended for Canadian residents only and does not constitute as an offer or solicitation by anyone in any jurisdiction in which such an offer is not allowed.