Market Insights: Bearish Investor Sentiment Hits Extreme – Contrarian Signal?
Milestone Wealth Management Ltd. - Feb 28, 2025
Macroeconomic and Market Developments:
- North American markets were mixed to positive this week. In Canada, the S&P/TSX Composite Index rose 0.98%. In the U.S., the Dow Jones Industrial Average was up 0.95% and the S&P 500 Index declined 0.98%.
- The Canadian dollar fell this week, closing at 0.69.1 cents vs 70.3 cents USD last week.
- Oil prices dropped again this week. U.S. West Texas crude closed at US$69.75 vs US$70.22 last week.
- The price of gold finally declined this week, closing at US$2,856 vs US$2,947 last week.
- In the U.S., personal income jumped 0.9% in January, driven by Social Security adjustments, while consumer spending fell 0.2%, signaling a cautious start to the year. Core PCE inflation, the Federal Reserve’s preferred inflation gauge, declined from a revised 2.9% annual rate in December to 2.6% in January, showing some progress towards the Fed’s 2% target. The overall PCE inflation rate also declined slightly from 2.6% to 2.5%. However, near-term rate cuts still seem unlikely.
- U.S. Real GDP growth in Q4 was unrevised at 2.3% annual rate, with consumer spending driving much of the gain, though the personal savings rate fell to 3.8%, raising concerns about sustainability. Meanwhile, business investment declined for the first time since 2021, and government spending, a key contributor, is set to temporarily slow due to DOGE-related cuts.
- Critics have linked Trump’s tariffs, immigration policies, and DOGE budget cuts to inflation, but historical data suggests otherwise. Inflation remains a monetary issue controlled by the Federal Reserve, not fiscal policy. During Trump’s first term, tariffs and lower immigration did not lead to high inflation, and DOGE—by cutting government spending—could actually support economic growth and ease long-term inflation pressures. However, inflationary effects from the Fed’s pandemic-era policies are still lingering, keeping CPI at 3.0% year-over-year.
- Trump Calls for Keystone XL Revival Despite Industry Pushback: President Donald Trump is urging a revival of the Keystone XL pipeline, promising "easy approvals" and an "almost immediate start." However, South Bow Corp., the company previously behind the project, has made it clear they have "moved on." While Trump has already revoked Biden’s executive order canceling the pipeline, key permits have expired, parts of the project have been dismantled, and Canada still faces a looming 10% tariff on crude exports. This move follows Trump’s broader push to restart stalled energy projects, including the Constitution Pipeline in the northeast.
- Nvidia posted solid quarterly results and issued a bullish revenue forecast, projecting $43 billion in fiscal Q1 sales—slightly above analyst expectations but falling short of the most aggressive estimates. Despite the strong outlook, shares have dropped 8% this week, reflecting market volatility and high investor expectations.
- Statistics Canada reported today that real GDP rose 2.6 per cent on an annualized basis in Q4. That’s well above economists’ expectation, as well as the Bank of Canada, both of which expected real GDP to rise 1.8 per cent annualized.
Weekly Diversion:
Check out this video: Happy Friday, let’s jump into the weekend!
Charts of the Week:
The widely followed American Association of Individual Investors (AAII) Sentiment Survey recently reported a significant surge in bearish (negative) sentiment, with 60.6% of respondents expressing a negative outlook. This level of bearishness is exceptionally high. Historically, such extreme bearish sentiment has been rare, with only six prior events of bearish sentiment of 60% or more, typically coinciding with major bear market lows, as shown in the charts below. These signals are important for contrarian investors because if everyone is bearish, there's less supply to sell, and the market often starts to rally (or vice-versa for bullish results). Without knowing any context, a surge in bearishness should, in theory, lead to positive market returns.
Source: Bespoke Investment Group
When we look at forward returns after these prior six instances of AAII Bears topping 60%, as shown in the table below, we can see mixed results in the very short-term. However, three to twelve-months out, the average forward returns for the S&P 500 Index were 8.7%, 16.6% and 27.9% which are all way above average for all periods. In addition, there was only one out of six negative instances after six months, and no negative instances after one year with the lowest being 15.2% which is still about 50% higher than all periods. It is important to note, however, the current situation is unique because stocks are only 3.14% below their 52-week highs, whereas previous instances of high bearishness occurred when stocks were at least 13% below their highs.
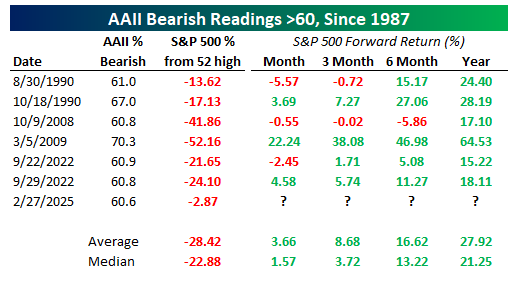
Source: Bespoke Investment Group
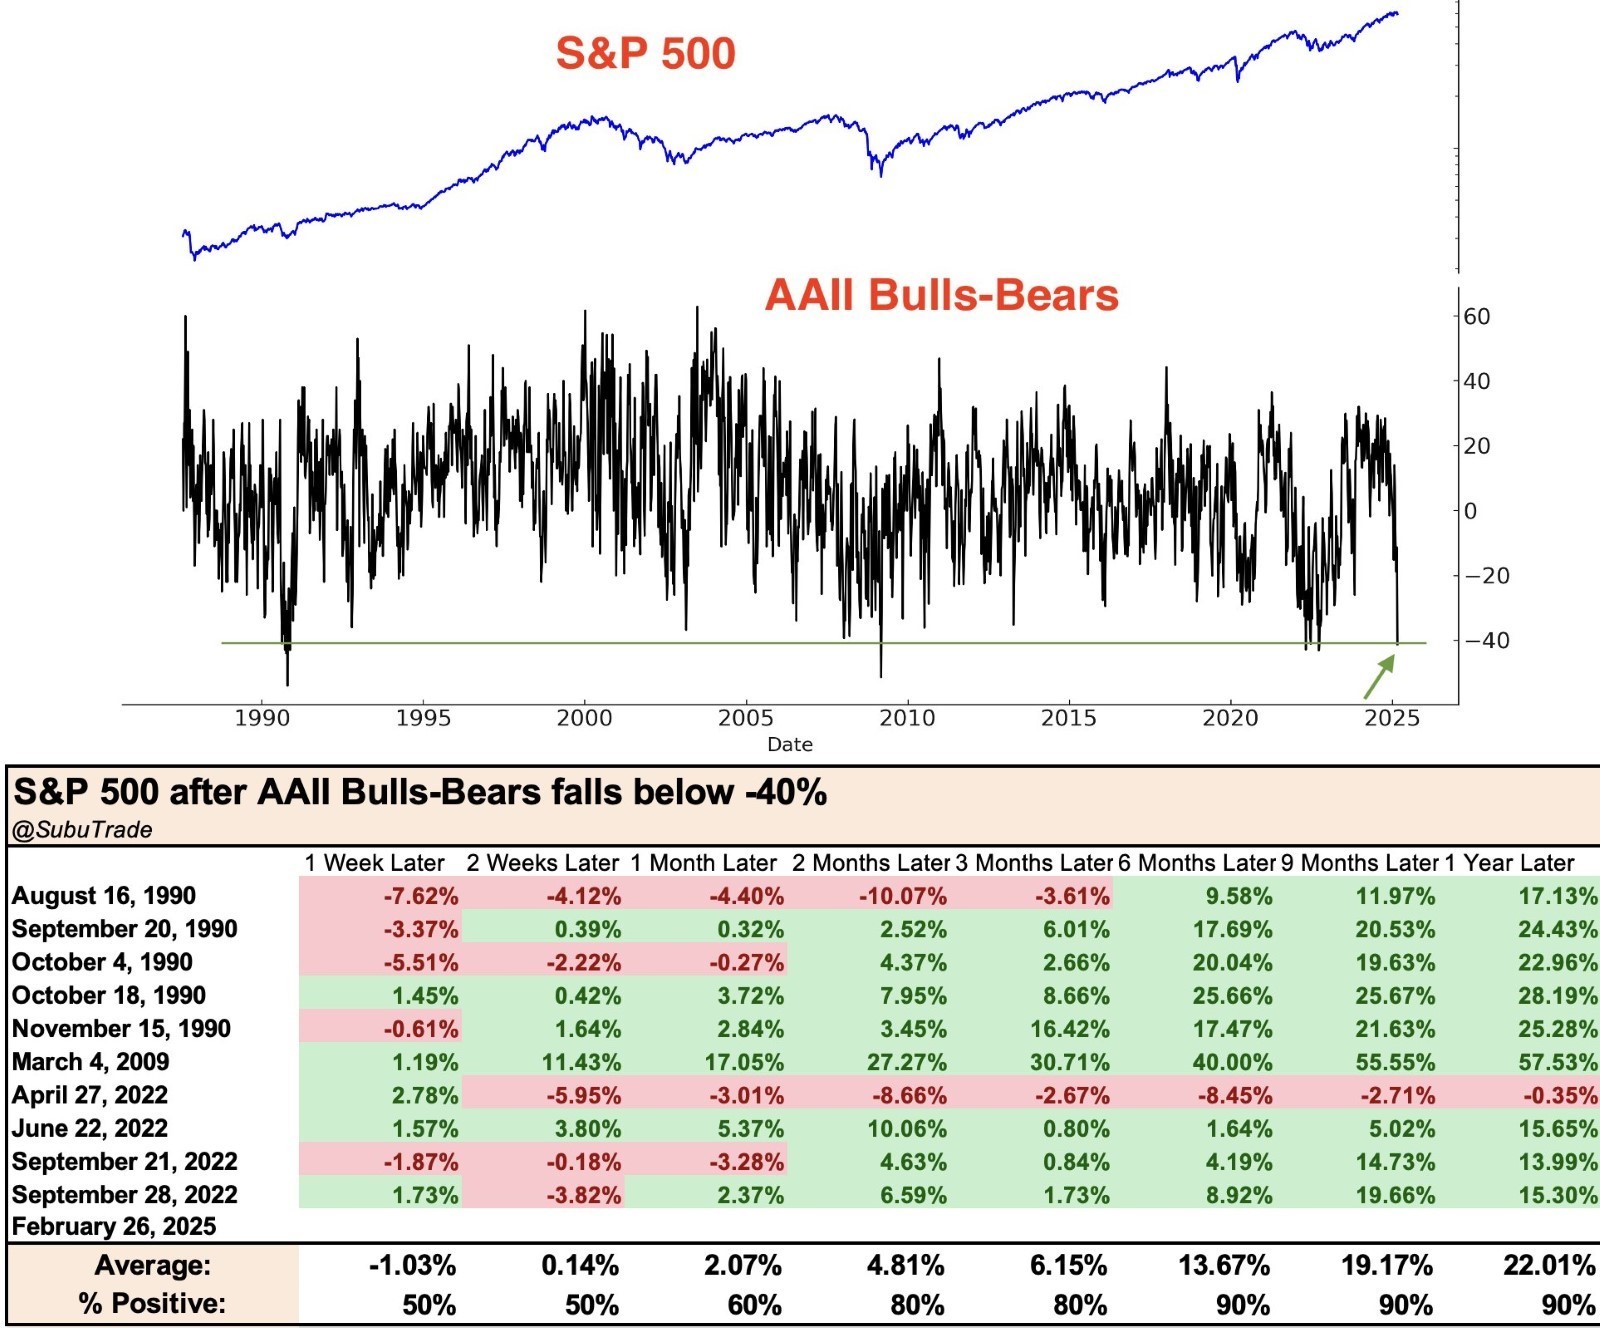
Another way of looking at this is to observe instances of bull-bear spreads where you subtract the percentage of bearish sentiment responses from bullish sentiment responses. When observing events of AAII bull-bear spreads below -40%, we see some overlap from the chart above. However, as shown in the next chart, we end up with 10 prior occurrences (Some of the dates are off slightly as different sources have used market close vs. market open data). Similarly to the chart above, very short-term forward returns for the S&P 500 were mixed; however, when observing six-months ahead or longer, average returns were extremely strong with the six-month average at 13.7%, the nine-month average at 19.2%, and the one-year average return at 22% with positive returns occurring 90% of the time.
Source: The Chart Report, @SubuTrade
Sources: Sources: yahoo finance, Globe and Mail, First Trust, Bloomberg, Hedgeye, Richardson Wealth, Bespoke Investment Group, The Chart Report, @SubuTrade
©2025 Milestone Wealth Management Ltd. All rights reserved.
DISCLAIMER: Investing in equities is not guaranteed, values change frequently, and past performance is not necessarily an indicator of future performance. Investors cannot invest directly in an index. Index returns do not reflect any fees, expenses, or sales charges. Opinions and estimates are written as of the date of this report and may change without notice. Any commentaries, reports or other content are provided for your information only and are not considered investment advice. Readers should not act on this information without first consulting Milestone, their investment advisor, tax advisor, financial planner or lawyer. This communication is intended for Canadian residents only and does not constitute as an offer or solicitation by anyone in any jurisdiction in which such an offer is not allowed.