Market Insights: A Good Start for January Could Mean...
Milestone Wealth Management Ltd. - Feb 07, 2025
Macroeconomic and Market Developments:
- North American markets were sluggish this week. In Canada, the S&P/TSX Composite Index slightly decreased 0.35%. In the U.S., the Dow Jones Industrial Average fell 0.54% and the S&P 500 Index dropped 0.24%.
- The Canadian dollar rose amidst tariff speculation this week, closing at 69.9 cents vs 68.8 cents last week.
- Oil prices fell again this week. U.S. West Texas crude closed at US$70.98 vs US$73.53 last week.
- The price of gold continued its steady climb this week, closing at US$2,886.7 vs US$2,833.7 last week.
- President Donald Trump enforced tariffs on Canada, China, and Mexico this week. However, both Canada and Mexico have had these delayed for at least 30 days. The development comes as Mexico's President Sheinbaum agreed to strengthen their northern border with 10,000 troops. Later that day, Trudeau took to X to report that Canada would be going ahead with its $1.3 billion border plan, involving nearly 10,000 personnel to stop the flow of fentanyl. Additionally, Trudeau said Canada would be appointing a "Fentanyl Czar." Trudeau also said they would list cartels as terrorists, and "launch a Canada- U.S. Joint Strike Force to combat organized crime, fentanyl and money laundering." And that he signed "a new intelligence directive on organized crime and fentanyl and we will be backing it with $200 million".
- January kicked off 2025 on a strong note for equities, reinforcing the historical trend known as the "January Effect," where a positive start often signals continued strength for the year. The S&P 500 gained 2.7% in January, aligning with past instances where a >2% January return has led to an average full-year gain of 18.4%, with stocks finishing higher nearly 88% of the time. While a late-month sell-off erased part of the initial gains, global markets also posted solid performances—Germany’s DAX surged 9.2%, France’s CAC 40 climbed 7.7%, and Canada’s TSX advanced 3.3%. Even with ongoing tariff concerns dominating headlines, history suggests that strong January returns set a bullish precedent, providing investors with an optimistic outlook for the remainder of the year.
- Employment numbers for January were released on Friday. In Canada, the economy created 76,000 jobs, with the unemployment rate dipping to 6.6%. In the U.S., nonfarm payrolls increased by 143,000 jobs, with the unemployment rate falling to 4.0%.
- Amazon Joins Tech Giants in Scaling Back DEI Initiatives: Amazon has removed references to "inclusion and diversity" from its latest annual report, aligning with a broader corporate trend as major tech firms, including Meta and Google, roll back DEI programs amid political and legal pressures.
- Gas Prices Surge 10% Year-Over-Year in Canada: The average price of gasoline across Canada has risen 10% compared to last year, now at $1.62 per litre. While some cities, like Kelowna and Winnipeg, saw the biggest price jumps last week, others, like Red Deer, experienced slight declines. Economists warn that ongoing tariff uncertainty could push fuel prices even higher in the coming months.
Weekly Diversion:
Check out this video: Should’ve been grateful the first time
Charts of the Week:
Despite a 1% drop last week, the S&P 500 Index still reached record highs on a monthly basis rising 2.7% in January. The S&P 500 also experienced a Bullish Outside Reversal Month (BORM), which means that January’s highs and lows exceeded the prior month’s high-low range. This was just the 8th such occurrence since S&P 500 inception, and as we can see in the table below, forward returns have historically been very strong over the next year. There is a lot of data on here, but we would like to highlight that after these January BORM instances, February has posted positive returns 86% of the time with an average return of 2.19%, and looking further out, the next 8-12 months have never closed lower. It is also worth noting that the average return one year later has been 16.4% (median 13.5%) which is well above the historical average for all years.
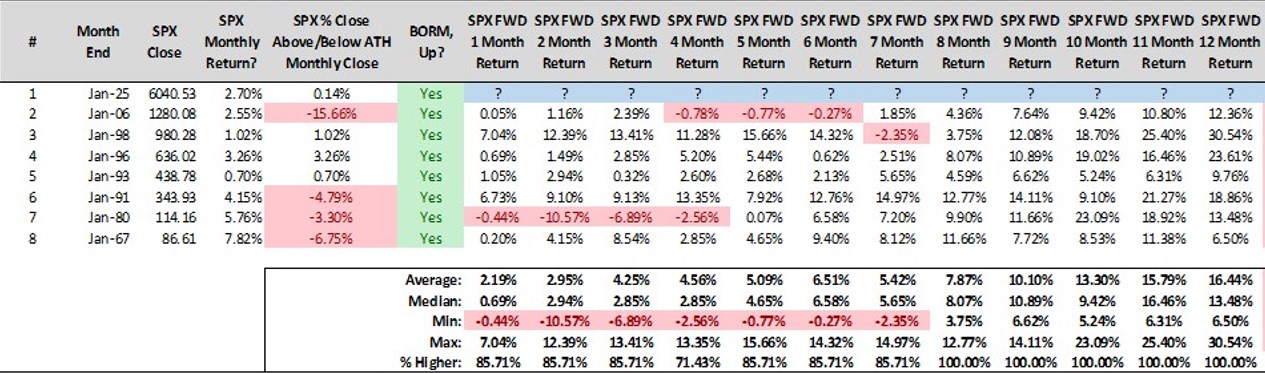
Source: The Chart Report, @Steve Deppe
Although we saw some late month volatility, the S&P 500’s performance for the month also provides reason for optimism. As the next table illustrates, when the S&P 500 is up 2% or more in January (32 prior occurrences), forward returns have also been very strong. For the final 11 months of the year, the average returns have been just above 12% with positive returns occurring over 84% of the time, and full calendar year returns have averaged a very strong 18.4% (almost double the average for all years), with positive returns occurring an impressive 87.5% of the time. In other words, strength in January has typically been followed by above average strength for the year.
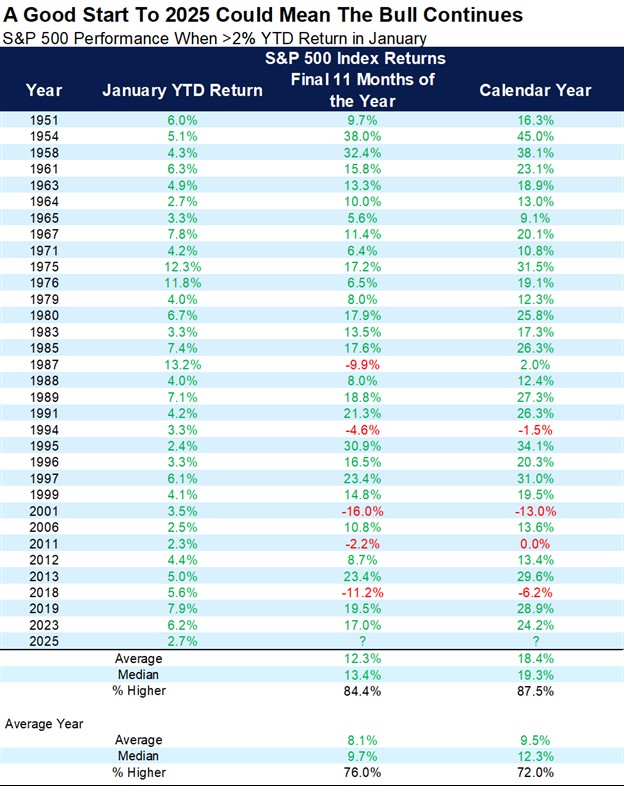
Source: Carson Investment Research, FactSet, @ryandetrick
Sources: CNBC, yahoo finance, Bloomberg, Thomson Reuters, Carson Investment Research, The Globe and Mail, Government of Canada, First Trust, Hedgeye, X, The Chart Report
©2025 Milestone Wealth Management Ltd. All rights reserved.
DISCLAIMER: Investing in equities is not guaranteed, values change frequently, and past performance is not necessarily an indicator of future performance. Investors cannot invest directly in an index. Index returns do not reflect any fees, expenses, or sales charges. Opinions and estimates are written as of the date of this report and may change without notice. Any commentaries, reports or other content are provided for your information only and are not considered investment advice. Readers should not act on this information without first consulting Milestone, their investment advisor, tax advisor, financial planner or lawyer. This communication is intended for Canadian residents only and does not constitute as an offer or solicitation by anyone in any jurisdiction in which such an offer is not allowed.