Market Insights: U.S. Election Years and Impact on Markets
Milestone Wealth Management Ltd. - Nov 01, 2024
Macroeconomic and Market Developments:
- North American markets were down this week. In Canada, the S&P/TSX Composite Index declined 0.84%. In the U.S., the Dow Jones Industrial Average fell 0.15% and the S&P 500 Index dropped 1.37%.
- The Canadian dollar was down this week, closing at 71.7 cents vs 72.0 cents USD last week.
- Oil prices were negative this week. U.S. West Texas crude closed at US$69.50 vs US$71.65 last week.
- The price of gold was down slightly this week, closing at US$2,743 vs US$2,756 last week.
- The Canadian economy grew at a modest 1% annualized rate in Q3, falling short of the Bank of Canada's 1.5% forecast and below economists' expectations of 1.2%. Preliminary data for September showed a 0.3% increase in GDP, with growth led by finance, insurance, construction, and retail.
- Meanwhile, the U.S. economy grew by an annualized 2.8% in Q3, helped by strong consumer spending. Overall growth was tempered by lower net exports and shrinking inventories, though core indicators like final sales to private domestic purchasers rose by 3.2%.
- U.S. employment numbers for October were released on Friday, with nonfarm payrolls only increasing by 12,000 for the month, with the Boeing strike and hurricanes affecting employment growth. The unemployment rate held at 4.1%, in line with expectations.
- The U.S. Fed’s preferred measure of inflation, the Personal Consumption Expenditures (PCE) deflator rose 0.2% in September and is up 2.1% from a year ago. The Core PCE deflator, which excludes food and energy, rose 0.3% in September and is up 2.7% in the past year.
- Calgary-based Canadian Natural Resources (CNQ) reported better than expected earnings of $0.97/share vs $0.91/share expected by analysts. Net capital expenditures were $1.35 billion vs $1.41 billion expected. The company is maintaining a strong balance sheet and financial flexibility, with approximately $6.2 billion in liquidity as of September 30th.
- It was a big week for big tech, with five of the Magnificent 7 reporting earnings this week:
- Google’s parent Alphabet (GOOGL) reported results above expectations with earnings of $2.12/share vs $1.85/share expected on revenue of $88.27 billion vs $86.30 expected.
- Microsoft (MSFT) also beat but forecasted slower cloud revenue growth for the upcoming period, with $3.30/share earnings vs $3.10 expected on $65.59 billion vs $64.51 billion revenue expected.
- Facebook and Instagram parent Meta Platforms (META) beat earnings and revenue forecasts but reported lower than expected daily active people. Earnings were $6.03/share vs $5.25/share forecast.
- Amazon (AMZN) impressed investors with earnings of $1.43/share vs $1.14/share expected on revenue of $158.88 billion vs $157.2 billion expected.
- Apple (AAPL) also beat on the top and bottom line, with $1.64/share earnings vs $1.60/share expected on $94.93 billion revenue vs $94.58 billion expected. During the quarter, the company paid a one-time income tax charge of $10.2 billion to resolve a long-running case dating back to 2016 over how the company handled taxes in Ireland.
Weekly Diversion:
Check out this video: Don’t forget to tip the cashier
Charts of the Week:
Amidst all the analysis and speculation for the current U.S. election that will take place on Tuesday, November 5th, one fundamental truth remains: voters, not polls or historical data, determine the outcome of elections. While the markets may provide interesting indicators and historical patterns may offer insights, the true power lies in the hands of the voters. For this week’s charts, we wanted to share several interesting visuals focusing on how elections have historically affected markets compared to this year, and how it may affect them going forward.
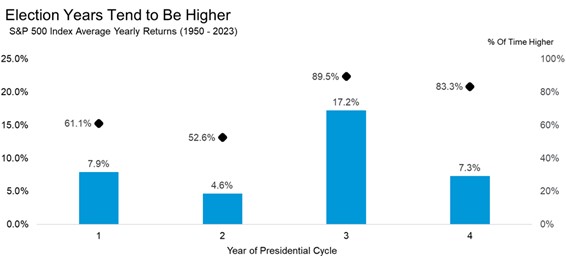
Chart 1: Election Years Tend to Be Higher
- Historical pattern: Pre-election years tend to be the best for stocks, while mid-term years are typically not as strong. Election years generally perform well, with an average gain of 7.3%.
- Frequency of positive returns: Election years have historically shown positive returns 83.3% of the time, which is a remarkably high percentage.
The current situation in 2024 has far exceeded these historical averages with the S&P 500 Index, outperforming the typical election year average by 15%. This strong performance aligns with the historical trend of election years being positive for stocks, but the magnitude of the gains has been notably higher than usual.

Source: Carson Investment Research, FactSet
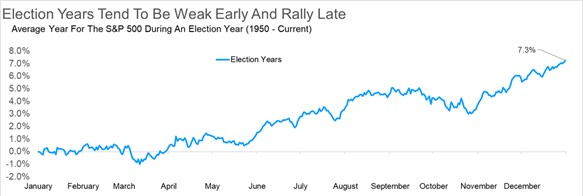
Chart 2: Election Years Tend to Be Weak Early and Rally Late
Historical pattern:
- Stocks typically decline in March of an election year.
- Mid-year gains are followed by a stall in pre-election months due to uncertainty.
- A rally often occurs after the election as market clarity improves.
- When a president is up for re-election, gains tend to be steadier throughout the year after a slow first quarter.
Actual performance in 2024:
- The first quarter was unexpectedly strong, with the S&P 500 up over 10% on a total return basis.
- Some periods of modest volatility have occurred during the year.
- The strong year-to-date performance may temper expectations for a significant post-election rally.
- Despite the early strength, historical trends still suggest the possibility of further gains after the election.
This year's market performance has deviated from the typical election year pattern, showing strength earlier than expected. However, the overall positive trend this year has aligned with the general tendency for election years to be favorable for stocks.

Source: Carson Investment Research, FactSet, @ryandetrick
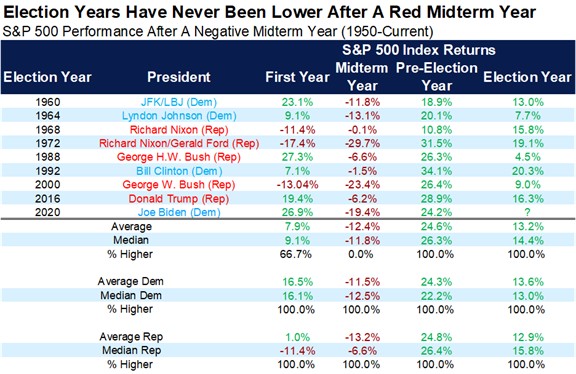
Chart 3: Election Years Have Never Been Lower After a Negative Mid-term Year
- Historical trend:
- After a negative return in a mid-term election year, the stock market has consistently shown positive returns in both the pre-election and election years.
- This pattern has held true for 17 consecutive instances.
- 2022-2024 cycle:
- 2022 was a mid-term year with negative returns, fitting the first part of this pattern.
- Based on this historical trend, both 2023 (pre-election year) and 2024 (election year) were expected to show positive returns.
- Current situation:
- As of the latest data, it appears highly likely that this pattern will continue.
- The odds strongly favor 2024 ending with positive returns, which would make it the 18th consecutive instance of this pattern holding true.
This trend underscores the resilience of the stock market following mid-term election years with negative returns and suggests an extremely high probability of positive market performance in the current election year.

Source: Carson Investment Research, FactSet, @ryandetrick
While these last charts have historically shown how election years have tended to perform based on certain criteria, what about the current political landscape and how that may affect markets going forward?
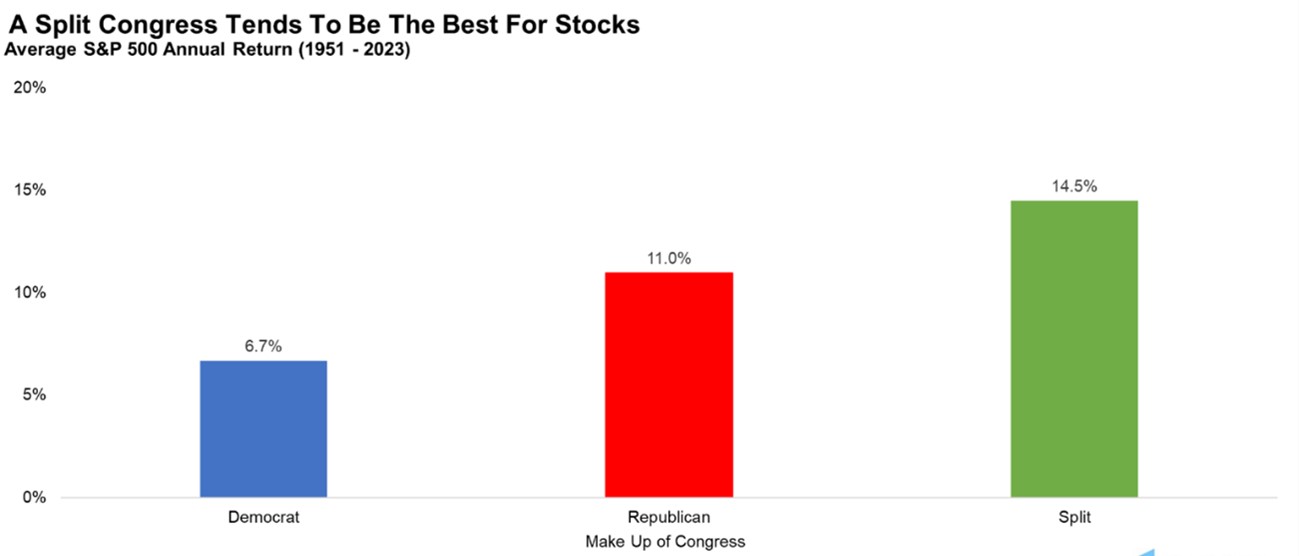
Chart 4: A Split Congress Tends to Be the Best for Stocks
- Main message: "It isn't about red or blue; it's about green."
- This phrase suggests that market performance is more important than political party affiliations.
- Recent performance (2023-2024):
- The market has performed well, supporting the idea that economic factors are more influential than political party control.
- Current Political landscape:
- Even if one party sweeps the elections, narrow majorities are expected.
- These narrow majorities are likely to create a political environment similar to a split Congress.
- Implications:
- The need for compromise in a narrowly divided Congress may lead to more moderate policies.
- This moderation could potentially benefit market performance, regardless of which party is in control.
- Consistency with historical trends:
- The strong market performance in 2023 and 2024 aligns with historical data showing that split or narrowly divided governments often correlate with positive market returns.
This summary reinforces the idea that investors should focus more on economic fundamentals and market performance ("green") rather than getting caught up in partisan political concerns ("red or blue") when making investment decisions.

Source: Carson Investment Research, FactSet, @ryandetrick
Sources: CNBC.com, Globe and Mail, Financial Post, Bloomberg, Thomson Reuters, Richardson Wealth, Carson Investment Research, FactSet, @ryandetrick
©2024 Milestone Wealth Management Ltd. All rights reserved.
DISCLAIMER: Investing in equities is not guaranteed, values change frequently, and past performance is not necessarily an indicator of future performance. Investors cannot invest directly in an index. Index returns do not reflect any fees, expenses, or sales charges. Opinions and estimates are written as of the date of this report and may change without notice. Any commentaries, reports or other content are provided for your information only and are not considered investment advice. Readers should not act on this information without first consulting Milestone, their investment advisor, tax advisor, financial planner