Market Insights: Swings in the VIX Bring Potential Gains in the S&P 500
Milestone Wealth Management Ltd. - Aug 16, 2024
Macroeconomic and Market Developments:
- North American markets were strong this week. In Canada, the S&P/TSX Composite Index was up 3.33%. In the U.S., the Dow Jones Industrial Average increased 2.94% and the S&P 500 Index was up 3.94%.
- The Canadian dollar was positive this week, closing at 73.1 cents vs 72.8 cents last week.
- Oil prices were down slightly this week. U.S. West Texas crude closed at US$76.72 vs US$76.97 last week.
- The price of gold was up this week, closing at a new all-time high of US$2,547 vs US$2,469 last week.
- Tourmaline Oil (TOU) announced that it is acquiring Crew Energy (CR) in an all-stock deal. The transaction values Crew at ~$6.69/share or $1.3 billion, including Crew's net debt.
- Scotiabank (BNS) has agreed to purchase a 14.9% stake in KeyCorp, a Cleveland-based regional bank, for approximately $2.8 billion. The acquisition is part of Scotiabank's strategy to enhance its presence in the U.S.
- Canadian engineering firm WSP Global (WSP) announced it has entered into an agreement to acquire Power Engineers, a U.S. consulting firm with a presence in the Power & Energy (P&E) sector. The US$1.78 billion deal is expected to be immediately accretive to WSP's adjusted net EPS before synergies.
- U.S. inflation continues to moderate. The CPI (Consumer Price Index) increased 0.2% for the month of July, putting the 12-month inflation rate at 2.9%. Excluding food and energy, the Core CPI came in at a 0.2% monthly increase and a 3.2% annual rate. The Producer Price Index (PPI), a measure of wholesale prices, rose 0.1% in July, and 2.2% compared to a year ago. Producer prices excluding food and energy were unchanged in July and are up 2.4% versus a year ago.
- Starbucks (SBUX) announced Tuesday that it is replacing CEO Laxman Narasimhan with Chipotle CEO Brian Niccol. In reaction to the news, Starbucks up was more than 20% on the day, whereas Chipotle’s stock fell over 10%.
Weekly Diversion:
Check out this video: New Zealand man becomes a hero in Manitoba
Charts of the Week:
The CBOE Volatility Index (VIX) which tracks the 30-day forward projection of volatility for the S&P 500, experienced unprecedented fluctuations in August, including the largest intraday spike and decline on record on August 5th. The chart below highlights movements in the VIX over the past 12 months while also showing the 50-DMA (daily moving average) and the 200-DMA. Within a week, the VIX saw one of its largest five-day increases, followed by one of its largest five-day declines. This extreme volatility prompted an analysis of how the S&P 500 historically performs following such significant VIX movements.
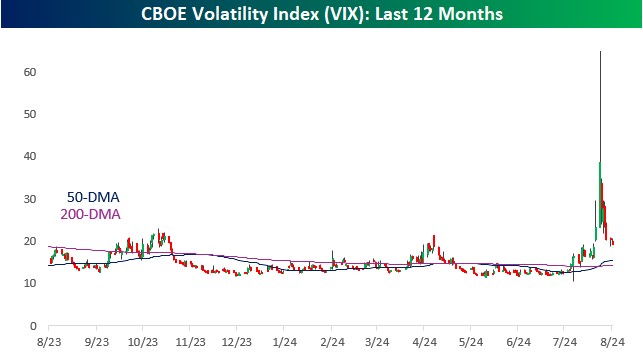
Source: Bespoke Investment Group
Surprisingly, the S&P 500's best one-year returns tend to follow periods when the VIX's five-day moves are at either extreme of the spectrum. When the VIX's five-day change falls in the 0-5th percentile or above the 95th percentile, the S&P 500's median one-year performance has been particularly strong, with gains of 14.50% and 15.06% respectively, as shown in the chart below proving median one year performance of the S&P 500 for different five-day point move percentile ranks. These returns significantly outperform those following more moderate VIX movements.
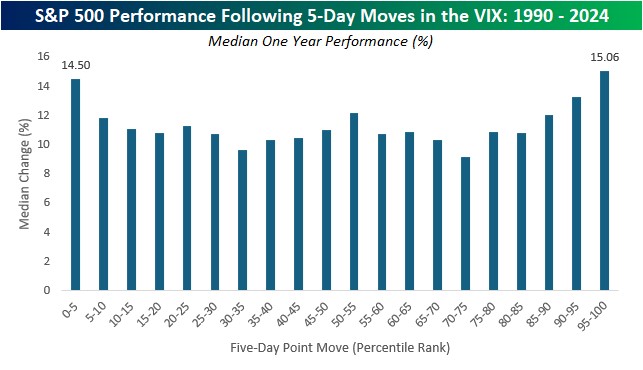
Source: Bespoke Investment Group
A closer examination of instances where the VIX declined (future expected volatility falling) by 15 points or more in five trading days reveals mixed short-term performance for the S&P 500. However, over longer periods, the index has shown consistently positive results. In all four historical instances, the S&P 500 was higher one year later, with gains ranging from 6.96% to 74.78%. While the sample size is small, these findings reinforce the observation that significant VIX declines often precede strong one-year returns for the S&P 500. The final chart below shows the performance of the S&P 500 one-month, three-months, six-months, and one year after a VIX decline by 15 points or more in a week.
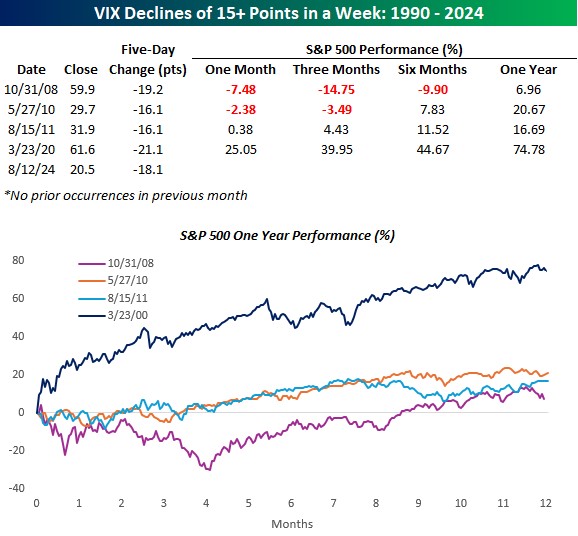
Source: Bespoke Investment Group
Sources: CNBC.com, Globe and Mail, Financial Post, Bloomberg, Thomson Reuters, Richardson Wealth, Bespoke Investment Group
©2024 Milestone Wealth Management Ltd. All rights reserved.
DISCLAIMER: Investing in equities is not guaranteed, values change frequently, and past performance is not necessarily an indicator of future performance. Investors cannot invest directly in an index. Index returns do not reflect any fees, expenses, or sales charges. Opinions and estimates are written as of the date of this report and may change without notice. Any commentaries, reports or other content are provided for your information only and are not considered investment advice. Readers should not act on this information without first consulting Milestone, their investment advisor, tax advisor, financial planner or lawyer. This communication is intended for Canadian residents only and does not constitute as an offer or solicitation by anyone in any jurisdiction in which such an offer is not allowed.