Market Insights: Volatility Returns to the Markets
Milestone Wealth Management Ltd. - Aug 09, 2024
Macroeconomic and Market Developments:
- North American markets were mixed this week. In Canada, the S&P/TSX Composite Index increased 0.38%. In the U.S., the Dow Jones Industrial Average fell 0.60% and the S&P 500 Index was dropped 0.04%.
- The Canadian dollar decreased slightly this week, closing at 72.8 cents vs 73.00 cents last week.
- Oil prices pulled back this week. U.S. West Texas crude closed at US$76.97 vs US$80.62 last week.
- The price of gold rose this week, closing at US$2,469 vs US$2,322 last week.
- The trading week started out on the back foot on Monday, with the S&P 500 down 3.0% while the Canadian markets were closed for the Civic Holiday. However, the rest of the week saw the markets slowly play catch up, finishing almost flat for the week.
- Japan’s stock market saw historic levels of volatility this week, with the Nikkei index falling by a shocking 12.4% on Monday, then bouncing back to finish the week down only 2.46%.
- Due to indications of a weakening U.S. economy, capped off by a weak jobs report last Friday, bond yields in the U.S. have dropped significantly. The 10-year treasury yield started the year at 3.95% and reached as high as 4.73% in April, but the recent plunge brings the interest rate back to almost exactly where it started the year, finishing the week at 3.94%.
- Canadian tech company Shopify (SHOP) got a lift this week after releasing sales and profits above analyst expectations. On Wednesday, the stock was up 17.85% on the news.
- Calgary-based Suncor Energy (SU) reported better than expected quarterly earnings of $1.27/share vs $1.10/share expected, cash flow of $2.65/share vs $2.32/share expected, and production of 770.6 Mboe/d vs 730.9 Mboe/d expected.
- Canada’s employment numbers were released on Friday. Our economy lost 2,800 jobs in July, with the unemployment rate remaining unchanged at 6.4%, having climbed by 0.9% in the past year.
Weekly Diversion:
Check out this video: Crazy Olympic Photo Moment
Charts of the Week:
This week, we saw significant volatility in global markets due to economic data including The Bank of Japan's recent interest rate hike and hawkish messaging which led to a stronger yen, causing investors to exit positions that had been based on the assumption of continued low rates. In addition, weak U.S. jobs data raised concerns about a potential economic downturn, affecting global markets. However, later in the week, new labor market data from the US showed lower-than-expected jobless claims, which helped boost investor confidence and contributed to a market rebound.
The chart below highlights this recent volatility, showing the performance of the S&P 500, going back to 2022 while also demonstrating 1-Day Percentage Changes in the index. As we can see in the bottom half of the chart, the 3.00% decline of the index on August 5th marked the second worst single day decline since September 13th, 2022, where the index fell 4.32%. This same week, we saw the index return 2.30% on Thursday, August 8th, marking the third highest single day gain since November 10th, 2022.
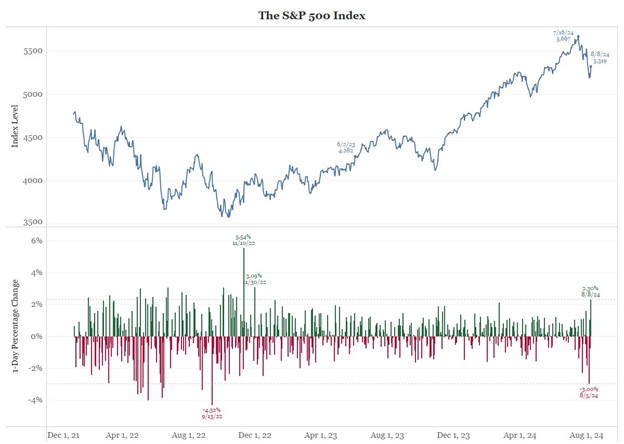
Source: Bloomberg via @biancoresearch
It is important to note that drawdowns are not uncommon for the S&P 500; however, the severity of the drawdown can be. As we can see in the chart below, the most recent intra-year drawdown of the S&P 500 of 8.49% from its peak on July 16th to trough on August 5th, was the 28th such occurrence since 1945 of a 5%-10% max drawdown, and the most common drawdown occurrence with 35% of total observations. Interestingly, more mild max drawdowns of 0%-5% are much rarer, occurring just seven times since 1945 and just 8.8% of total occurrences.
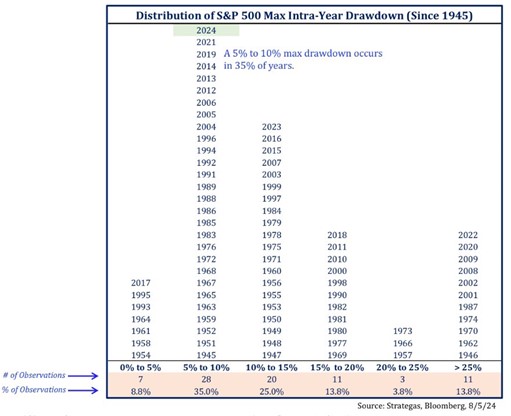 Source: Strategas, Bloomberg, via @Todd_Sohn
Finally, on an interesting note, the 1% or more drawdown that was observed in the S&P 500 on Thursday the 1st, Friday the 2nd, and Monday the 5th, has provided positive outlook in past instances. As we can see in the chart below, since 1950, when there has been a drawdown of more than 1% on a Thursday, Friday, and Monday, the returns 1-month out have averaged 5.0% with positive returns occurring 81% of the time, returns 3-months out averaged 9.8% with positive returns occurring 90.5% of the time, returns 6-months out averaged 13.4% with positive returns occurring 85.7% of the time, and returns 12-months out averaging 22.5% with positive returns also occurring 85.7% of the time. Time will tell if this year follows a similar path.
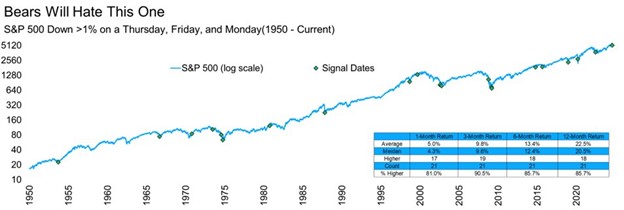
Source: Carson Investment Research, FactSet, via @RyanDetrick
Sources: CNBC.com, Globe and Mail, Financial Post, Bloomberg, Thomson Reuters, Richardson Wealth, Bespoke Investment Group, Carson Investment Research, FactSet, Strategas, Bloomberg, @biancoresearch, @Todd_Sohn, @RyanDetrick
©2024 Milestone Wealth Management Ltd. All rights reserved.
DISCLAIMER: Investing in equities is not guaranteed, values change frequently, and past performance is not necessarily an indicator of future performance. Investors cannot invest directly in an index. Index returns do not reflect any fees, expenses, or sales charges. Opinions and estimates are written as of the date of this report and may change without notice. Any commentaries, reports or other content are provided for your information only and are not considered investment advice. Readers should not act on this information without first consulting Milestone, their investment advisor, tax advisor, financial planner or lawyer. This communication is intended for Canadian residents only and does not constitute as an offer or solicitation by anyone in any jurisdiction in which such an offer is not allowed.