Market Insights: August Performance During Election Years
Milestone Wealth Management Ltd. - Aug 02, 2024
Macroeconomic and Market Developments:
- North American markets were negative this week. In Canada, the S&P/TSX Composite Index shrank 2.57%. In the U.S., the Dow Jones Industrial Average fell 2.10% and the S&P 500 Index waned 2.06%.
- The Canadian dollar devalued slightly this week, closing at 72.10 cents vs 72.30 cents last week.
- Oil prices dropped this week. U.S. West Texas crude closed at US$74.12 vs US$76.88 last week.
- The price of gold rallied this week, closing at US$2,482 vs US$2,384 last week.
- After the FOMC’s decision to leave the fed funds target rate unchanged between 5.25% and 5.5%, Fed Chair Powell said an interest rate cut could happen as soon as September if conditions, including confidence on inflation and maintaining a solid job market, were met. In their statement, the FOMC made several modifications to their statement, signaling they are closer to an easing interest rate path.
- In the US, the ISM Manufacturing Index (one of the Fed’s main indicators for US economic health) declined to 46.8 in July, widely lagging the consensus expected 48.8. (Levels higher than 50 signal expansion; levels below 50 signal contraction.) Activity has now contracted for twenty out of the last twenty-one months.
- Tech Stocks:
- Meta Platforms Inc. (META) reported better-than-expected sales in the second quarter, signaling that the company’s investments in AI are helping it sell more targeted ads. Meta had 3.27 billion users across all of its apps as of June 30, up 7% from a year earlier. The Facebook and Instagram parent company reported sales of $39.1 billion for the quarter ended June 30, compared with analysts’ estimates of $38.3 billion. Meta expects sales for the current quarter of $38.5 billion to $41 billion, compared with the average projection for $39.2 billion.
- Apple (AAPL) beat earnings expectations despite a year-over-year decline in iPhone sales. Apple announced revenue for the quarter at $85.78 billion vs. an estimated $84.53 billion and earnings per share of $1.40 vs. an estimated $1.35.
- Amazon (AMZN) reported third quarter sales guidance that missed analyst estimates. The company guided to a range of $154 billion to $158.5 billion in sales for the period, compared to analyst forecasts of $158.43 billion.
- Exxon Mobil Corp. (XOM) beat profit expectations after the $63 billion acquisition of Pioneer Natural Resources Co. pushed oil and natural gas output to a record. The Pioneer takeover closed in early May, helping lift Exxon’s overall production by 15% on a sequential basis, and setting the stage for daily output to average more than 4 million barrels this year. Exxon’s results provide assurance to investors that the oil giant is well-placed to execute a 15% ramp-up in share buybacks to $20 billion a year even despite bearish crude-market signals.
Weekly Diversion:
Check out this video: Mario Kart in Real Life
Charts of the Week:
August has historically been a weak month for stocks. However, things look quite different in election years. The first chart’s historical data illustrates that June, July, and August are collectively the best three months of an election year, posting 3-month average rolling returns of 7.3%, 5.2% and 2.1%, respectively, with positive returns occurring 62.5% to 75% of the time from 1928-2020. This trend has been consistent enough to challenge the conventional wisdom about summer market behavior.
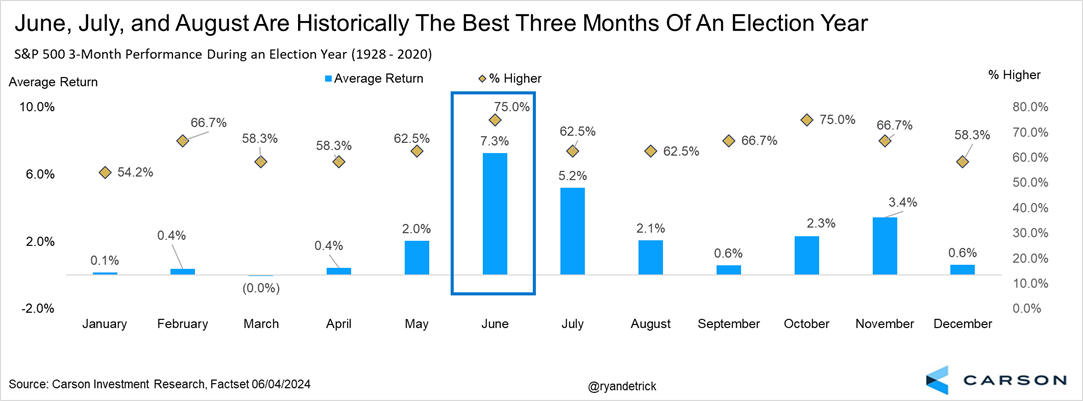
Source: Carson Investment Research, @ryandetrick
The next chart highlights the average performance of the S&P 500 Index since 1950, over the past 10 and 20 years, and lastly during election years. As we can see, there is a stark difference in performance between these non-election and election years in the month of August, in this case a positive difference.
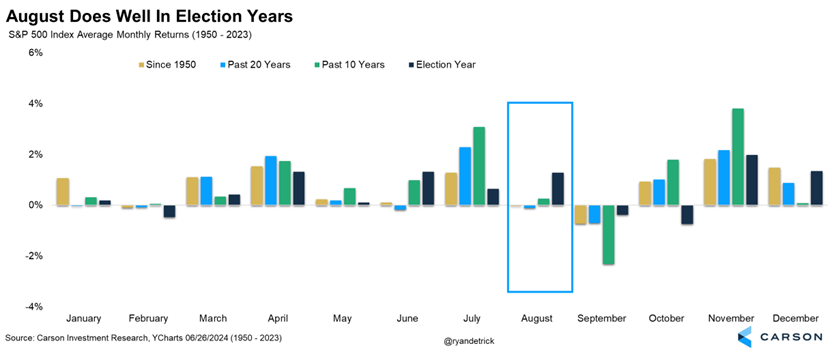
Source: Carson Investment Research, @ryandetrick
Despite the generally positive outlook for August in election years, investors should be prepared for potential market corrections in September and October. As the last chart shows, during the period of 1950-2023 for elections years, September and October have posted average returns of -0.4% and -0.7% with positive returns for both months occurring just 50% of the time. It is important to note, however, that there has typically been a post-election bounce for stocks with November and December posting average returns of 2.0% and 1.2% and posting positive returns 61.1% and 83.3% of the time, respectively.
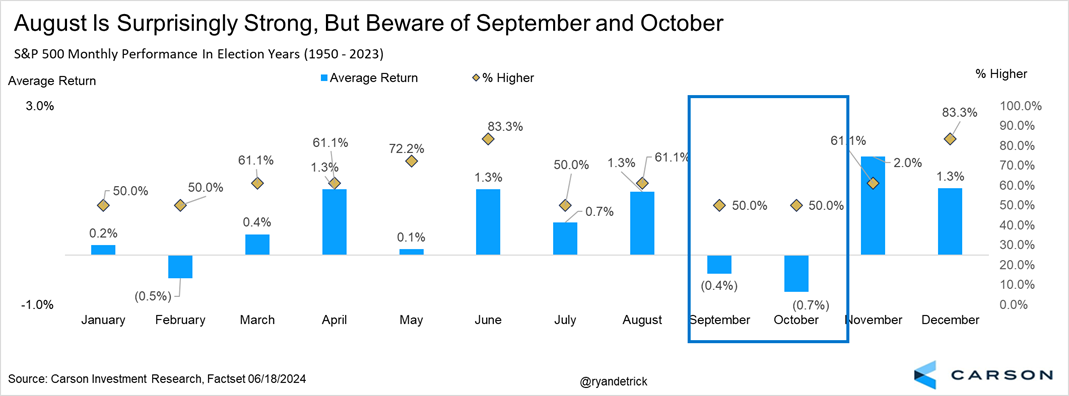
Source: Carson Investment Research, @ryandetrick
Sources: CNBC.com, Globe and Mail, Financial Post, Bloomberg, Thomson Reuters, Richardson Wealth, Carson Investment Research, @ryandetrick
©2024 Milestone Wealth Management Ltd. All rights reserved.
DISCLAIMER: Investing in equities is not guaranteed, values change frequently, and past performance is not necessarily an indicator of future performance. Investors cannot invest directly in an index. Index returns do not reflect any fees, expenses, or sales charges. Opinions and estimates are written as of the date of this report and may change without notice. Any commentaries, reports or other content are provided for your information only and are not considered investment advice. Readers should not act on this information without first consulting Milestone, their investment advisor, tax advisor, financial planner or lawyer. This communication is intended for Canadian residents only and does not constitute as an offer or solicitation by anyone in any jurisdiction in which such an offer is not allowed.