Market Insights: Why A Good First Half for Stocks Could Bode Well for the Second Half
Milestone Wealth Management Ltd. - Jul 05, 2024
Macroeconomic and Market Developments:
- North American markets were positive this week. In Canada, the S&P/TSX Composite Index rose 0.85%. In the U.S., the Dow Jones Industrial Average increased 0.66% and the S&P 500 Index was up 1.95%.
- The Canadian dollar increased this week, closing at 73.30 cents vs 73.00 cents USD last week.
- Oil prices rose again this week. U.S. West Texas crude closed at US$83.34 vs US$80.62 last week.
- The price of gold jumped this week, closing at US$ 2,391 vs US$2,322 last week.
- Canadian GDP Growth slows: Preliminary data shows a 0.1% GDP increase in May, down from the 0.3% increase in April. Growth was driven by manufacturing, real estate, and finance, offsetting declines in retail and wholesale trade.
- Manufacturing sector contracts: The U.S. ISM Manufacturing Purchasing Managers Index (PMI) came in at 48.5 in June vs 48.7 in May (readings under 50 indicate contraction). This is the third consecutive month below 50 and was lower the 49.1 expected by economists. Meanwhile in Canada, the Manufacturing PMI came in unchanged for June at 49.3, the 14th consecutive month under the 50 mark.
- Tesla beats expectations: Tesla’s total deliveries hit 443,956 vehicles in the second quarter, with total production at 410,831 vehicles over the period, beating analysts’ expectations. As a result, the stock price, which had been in a decline for the past year, was up 27.1% this week.
- Amazon founder unloads shares: Jeff Bezos has disclosed a plan to sell 25 million additional shares of Amazon (AMZN) worth $5 billion, on the day the stock hit a fresh record. Bezos would still hold nearly 912 million shares, or about 8.8% of Amazon, following the sale.
- Employment numbers released on Friday: In Canada, the Labour Force Survey shows that the Canadian economy lost 1,400 jobs, well below the estimates looking for a gain of 25,000. The unemployment rate rose from 6.2% to 6.4%. Conversely, the U.S. Nonfarm Payrolls report showed a gain of 206,000 jobs, slightly above the 190,000 expected, but the unemployment rate rose from 4.0% to 4.1%, tied for the highest level since October 2021.
Weekly Diversion:
Check out this video: Inflation is tough all over
Charts of the Week:
The S&P 500 Index experienced a strong first half of 2024, rising 14.5% on a price basis, while the Dow Jones Industrial Average gained 3.8% and the NASDAQ increased by 18%. This performance was notably driven by the "Magnificent 7" mega-cap tech stocks, with Nvidia's gains contributing significantly to the S&P 500's rise. In fact, Nvidia contributed a whopping 31% of the S&P 500’s first half return. Even without these top performers, the index still outperformed its historical average for the first six months of the year, which typically sees a 4.2% increase.
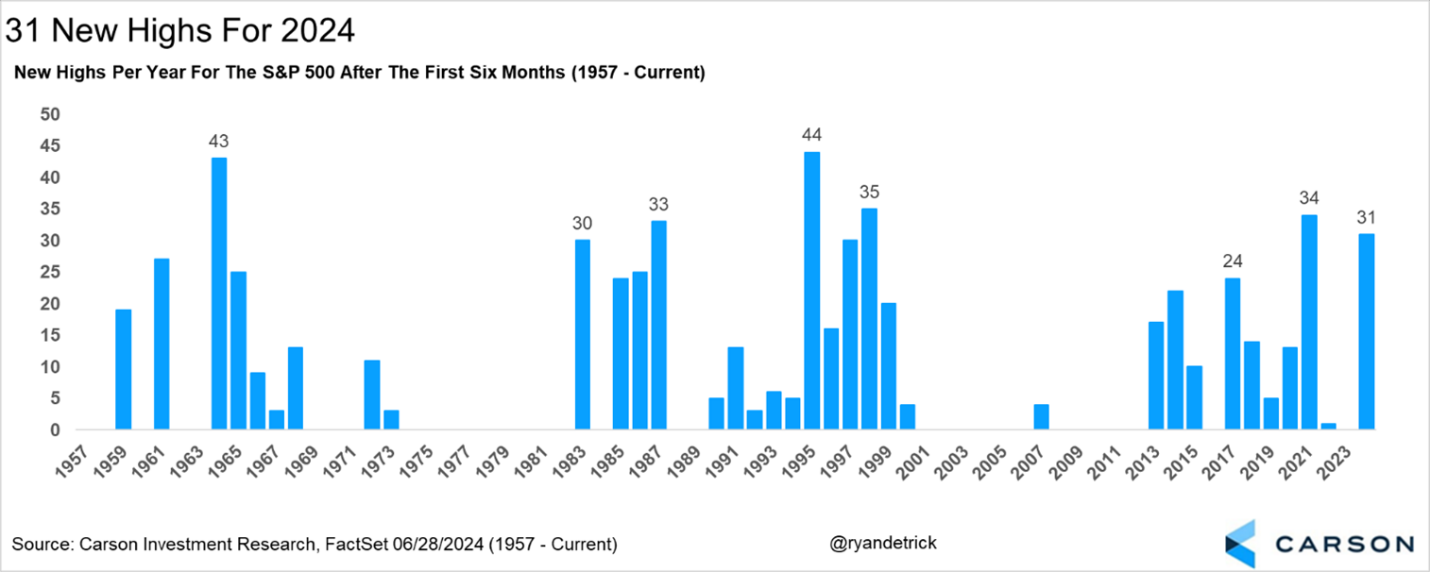
A striking feature of the market's performance in the two quarters of 2024 was the persistent number of new highs achieved by the S&P 500. The index reached 31 new all-time highs during this period, second only to 2021 in the current millennium, as shown in the first chart. Historically, when the S&P 500 has recorded 20 or more all-time highs by the midpoint of the year, it has always gone on to achieve at least one more new high in the second half, with an average of 20 additional new highs. As the second chart shows, in these instances the average and median returns for the remainder of the year are 5.7% and 9.6% with positive returns 80% of the time, compared to the all-year average and median returns since 1950 of 4.8% and 5.6% with positive returns occurring 71.6% of the time.

Source: Carson Investment Group, @RyanDetrick

Source: Carson Investment Group, @RyanDetrick
Based on historical trends, a strong return performance in the first half of the year has produced much better returns on average for the second half. When the S&P 500 has been up by double digits at midyear as it is this year, the second half has typically outperformed the average year, with an average and median gain of 7.7% and 9.8% compared to 4.8% and 5.6% for all years as shown in the last chart. Moreover, in these strong first-half years, the full year has never ended lower, with an average annual gain of 25.1% compared to the all-year average since 1950 at 9.3%. However, in these 23 prior occurrences, there have been four down second halves with a -7.4% average decline (17% of the time). Let’s hope this year is not in the minority in that respect.

Source: Carson Investment Group, @RyanDetrick
Sources: CNBC.com, Globe and Mail, Financial Post, Bloomberg, Thomson Reuters, Richardson Wealth, Bespoke Investment Group
©2024 Milestone Wealth Management Ltd. All rights reserved.
DISCLAIMER: Investing in equities is not guaranteed, values change frequently, and past performance is not necessarily an indicator of future performance. Investors cannot invest directly in an index. Index returns do not reflect any fees, expenses, or sales charges. Opinions and estimates are written as of the date of this report and may change without notice. Any commentaries, reports or other content are provided for your information only and are not considered investment advice. Readers should not act on this information without first consulting Milestone, their investment advisor, tax advisor, financial planner or lawyer. This communication is intended for Canadian residents only and does not constitute as an offer or solicitation by anyone in any jurisdiction in which such an offer is not allowed.