Market Insights: July Seasonality
Milestone Wealth Management Ltd. - Jun 28, 2024
Macroeconomic and Market Developments:
- North American markets were mixed this week. In Canada, the S&P/TSX Composite Index increased 1.56%. In the U.S., the Dow Jones Industrial Average fell 0.08% and the S&P 500 Index was down 0.05%.
- The Canadian dollar increased slightly this week, closing at 73.10 cents vs 73.00 cents last week.
- Oil prices rose this week. U.S. West Texas crude closed at US$81.51 vs US$80.62 last week.
- The price of gold was up slightly this week, closing at US$2,346 vs US$2,322 last week.
- Sky-High Summer: Domestic Flight Prices Soar: Despite expectations for a drop in prices as post-COVID travel demand eased, a new report shows domestic flight costs have increased by 14% this summer compared to last year, with short regional flights seeing the highest hikes (e.g., Edmonton to Vancouver: +82%). The main reasons include airline consolidation and Boeing’s slowed production to avoid further mid-flight safety issues.
- Canada Inflation Increases to 2.9%, Stalls July Rate Cut Prospects: Canada's inflation unexpectedly rose to 2.9% in May, up from 2.7% in April, driven by higher service prices. This increase may deter the Bank of Canada from further interest rate cuts in July, as policymakers monitor whether this trend persists.
- Rivian and Volkswagen Join Forces: $5B Investment to Drive Next-Gen EV Innovation: Electric vehicle maker Rivian Automotive (RIVN) announced that the company would form a joint venture with Volkswagen. The initial and planned investments by VW of $5 billion would create next-gen electrical architecture and best-in-class software technology.
- U.S. New Home Inventory Surges to 2008 Levels Amid Slowing Construction: U.S. new home inventory surged to its highest since 2008 at 481,000 in May, including nearly 100,000 unsold completed homes. Builders may reduce new construction as inventory duration extends to 9.3 months, awaiting better borrowing costs for affordability.
- U.S. Bond Market Rebounds, Faces Election-Driven Volatility: After two months of gains, the U.S. bond market has nearly erased its annual losses, with the Treasury index down just 0.15%. Traders align with the Fed's higher-for-longer rate stance, but potential rate cuts and the upcoming presidential election could add volatility. High deficit spending and ballooning debt continue to pressure long-term Treasury yields.
- U.S. Inflation Cools: The U.S. Fed’s preferred inflation measure, the core Personal Consumption Expenditures price index (PCE) increased just a seasonally adjusted 0.1% for the month and was up 2.6% from a year ago. May marked the lowest annual rate since March 2021, which was the first time in this economic cycle that inflation topped the Fed’s 2% target.
Weekly Diversion:
Check out this video: Bottled Sunshine: Illuminating Lives with Simple Innovation
Charts of the Week:
June is quickly coming to a close, marking the half-way point of 2024, with the S&P/TSX Composite and S&P 500 Index up 4.38% and 14.48% year-to-date (YTD) on price basis, respectively. As we have noted in recent comments, the U.S. market has been dramatically lifted up this year by mega-cap tech companies, some of whose valuations have become stretched. For fixed income markets, however, it has been a more difficult environment, with the FTSE Canada Universe Bond Index down about 0.2% total return at mid-year.
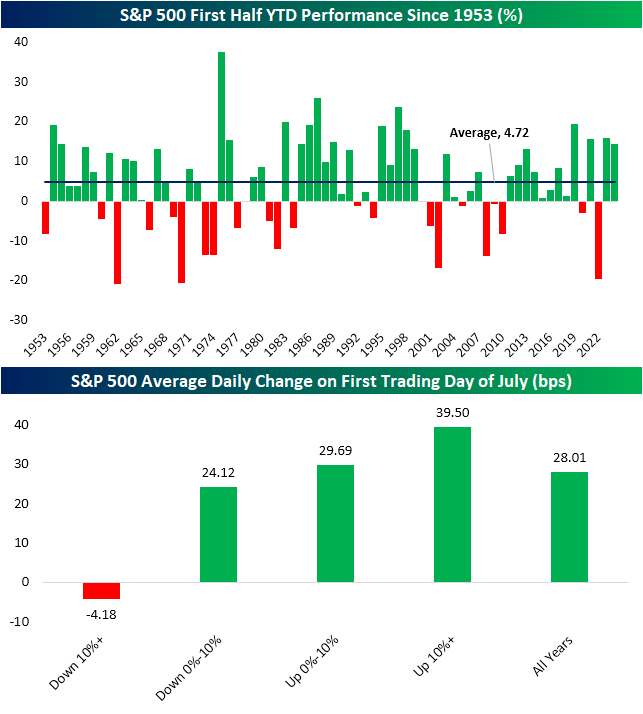
The first chart below shows that this year’s YTD return for the S&P 500 is closely in line with 2023 and 2021, and far outpacing the average since 1953 (represented by the blue line) of 4.72%. Looking forward to July, this year’s YTD return of over 10% offers reason for optimism to kick off the month, as stronger YTD numbers tend to provide favourable returns on the first trading day of July. As we can see in the second chart below, since 1953, when the S&P 500 experiences 10%+ returns for the first half of the year, the average daily change on the first day of trading in July is 39.50 bps which far outpaces the all-years average of 28.01 bps.

Source: Bespoke Investment Group
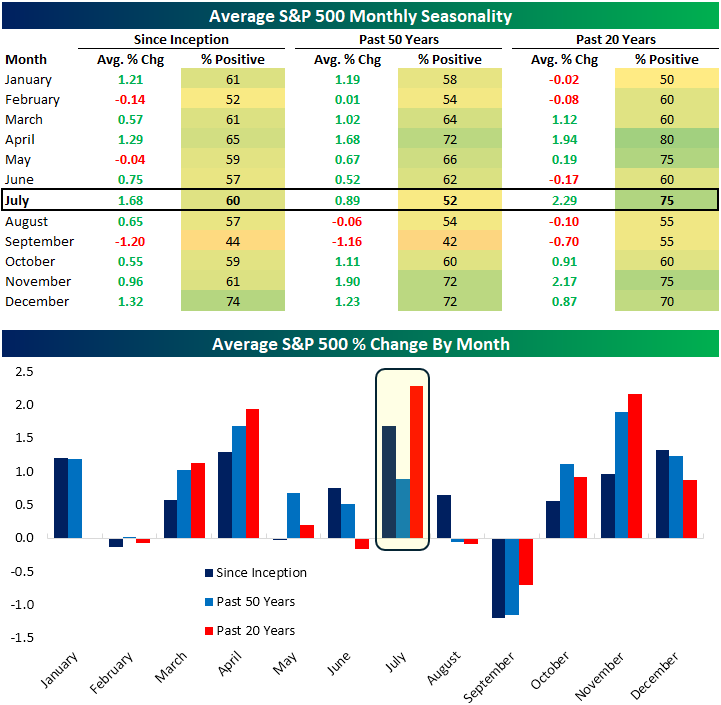
As the next chart illustrates, July has historically been a very strong performing month for the S&P 500, with the month being the top performer of all months since inception and for the last 20 years, averaging returns of 1.68% and 2.29% with positive returns occurring 60% and 75% of the time, respectively. This strength also extends to the blue-chip Dow Jones Industrial Average, where it has also been the strongest month of the year since inception, and the second strongest over the past 20 years with an impressive 80% positive return rate. It is also important to note that global market performance in July tends to follow similar patterns to the U.S. market during this period.

Source: Bespoke Investment Group
It is important to consider the broader market environment, sector-specific conditions and individual stock fundamentals, alongside seasonal trends. While seasonality can provide useful insights, it should not be an isolated factor in making investment decisions.
Sources: CNBC.com, Globe and Mail, Financial Post, Bloomberg, Thomson Reuters, Connected Wealth, Bespoke Investment Group
©2024 Milestone Wealth Management Ltd. All rights reserved.
DISCLAIMER: Investing in equities is not guaranteed, values change frequently, and past performance is not necessarily an indicator of future performance. Investors cannot invest directly in an index. Index returns do not reflect any fees, expenses, or sales charges. Opinions and estimates are written as of the date of this report and may change without notice. Any commentaries, reports or other content are provided for your information only and are not considered investment advice. Readers should not act on this information without first consulting Milestone, their investment advisor, tax advisor, financial planner or lawyer. This communication is intended for Canadian residents only and does not constitute as an offer or solicitation by anyone in any jurisdiction in which such an offer is not allowed