Market Insights: Sell in May and Go Away?
Milestone Wealth Management Ltd. - May 10, 2024
Macroeconomic and Market Developments:
- North American markets were up strongly this week. In Canada, the S&P/TSX Composite Index rose 1.65%. In the U.S., the Dow Jones Industrial Average climbed by 2.16% and the S&P 500 Index increased grew 1.85%.
- The Canadian dollar increased slightly this week, closing at 73.14 cents vs 73.07 cents USD last week.
- Oil prices were essentially flat this week. U.S. West Texas crude closed at US$78.35 vs US$78.04 last week.
- The price of gold jumped this week, closing at US$2,363 vs US$2,301 last week.
- Berkshire Hathaway's Warren Buffett wants his expected successor Greg Abel to take over stock investing decisions if he were to step down. "He understands businesses extremely well, and if you understand businesses, you understand common stocks". The statement came at the annual shareholders’ meeting after the conglomerate posted a 39% jump in its Q1 operating profit, along with a cash pile that hit a record $189 billion.
- Suncor Energy (SU) reported better than expected earnings of $1.41/share vs $1.24/share expected, an adjusted funds flow per share beat of $2.46/share vs $2.42/share and a production beat of 835.3 Mboe/d vs 832.6 Mboe/d.
- Apple (AAPL) unveiled a new AI-focused iPad Pro and a larger iPad Air, aiming to reinvigorate a tablet lineup that has deteriorated over the past two years and is the first redesigned version of the iPad Pro since 2018. The new model is thinner, includes a crisper Ultra Retina XDR screen with OLED technology, and has a faster M4 chip that can handle AI tasks. The new iPad Air looks like the prior version, but with a larger screen-size option and the M2 processor.
- Disney (DIS) reported fiscal second-quarter profit that beat estimates, helped by narrower losses in its streaming TV business and higher ticket prices at theme parks. Disney raised its guidance for full-year earnings growth to 25% from 20%. Still, revenue fell short of projections, and overall Disney+ subscribers came in lower than expected.
- Canadian employment numbers for April were released on Friday. Statistics Canada says employment increased by 90,000 in April, while the jobless rate held steady at 6.1% with employment gains driven by part-time work.
- The Biden administration is set to announce new tariffs on Chinese electric vehicles and other key sectors like batteries and solar equipment on Tuesday. These tariffs stem from a review of the Trump-era Section 301 tariffs that began in 2022.
Weekly Diversion:
Check out this video: Mr. Beast Philanthropy Powers a Remote Village
Charts of the Week:
The "Sell in May and go away" investment axiom suggests that the six-month period from May to October has historically been the weakest period for the stock market. The first chart highlights the performance of the S&P 500 Index over different 6-month increments since 1950. As we can see, November through April has indeed been the strongest performing period with returns averaging 6.9% and positive returns occurring 76.7% of the time. In contrast, May to October has historically been the weakest, averaging returns of 1.7% and positive returns occurring 64.9% of the time. While this axiom has proved to be correct in a general sense, it is only looking at one specific point in time from start to finish. There are periods of time, depending on the start date, during the weaker months that have strong returns. It can also depend on individual companies and sectors which may have different seasonal patterns. In addition, this is on average, and does not account for the fact that returns are generally still positive over the weaker periods.
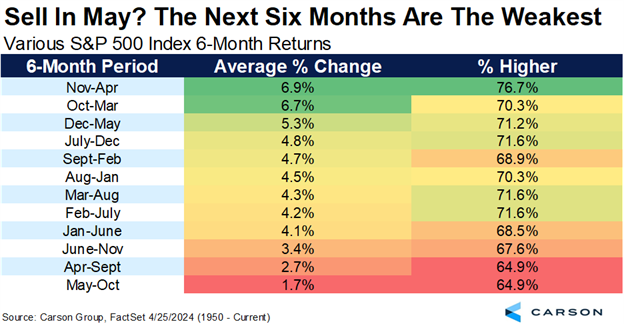
Source: Carson Investment Research, FactSet
However, this pattern has not held true in recent years. In fact, the S&P 500 has gained in eight of the last ten years (80% positive rate) from May to October with an average return of 4.0%. In fact, the month of May alone has performed quite well over the past ten years, posting positive returns in nine of the past ten years averaging 0.7%. The next two charts illustrate these data points with the performance of the S&P 500, focusing on returns from May to October in the first chart, and just the month of May in the second.
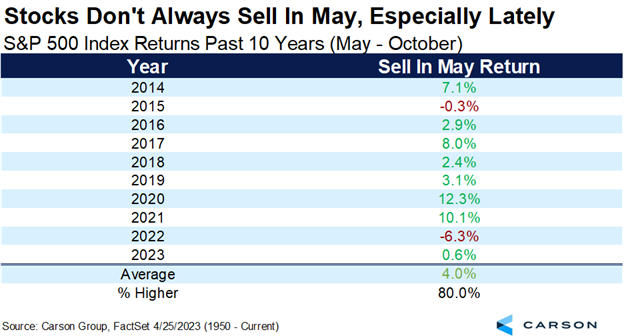
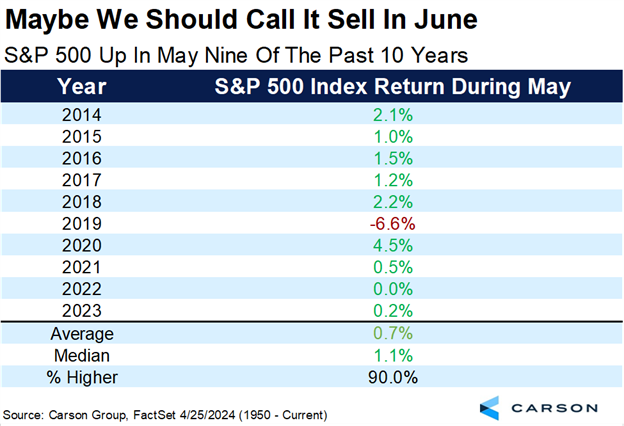
Source: Carson Investment Research, FactSet
Additionally, election years have historically seen a stronger May to October period than non-election years, with the market up 2.3% on average and higher 77.8% of the time, and especially June and August. The chart below highlights the performance again of the S&P 500, except now focusing on only election years going back to 1950. As we can see by the yellow highlighted summer months, election years tend to see more positive returns.
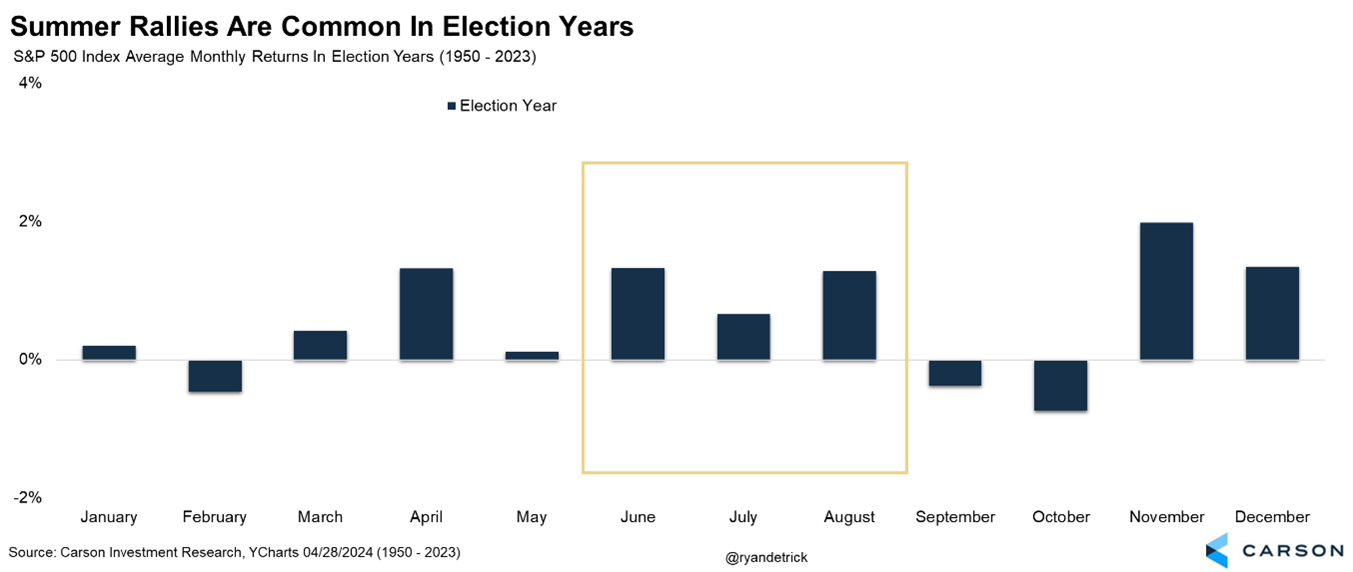
Source: Carson Investment Research, YCharts
Given the volatility seen in the markets of late, largely due to inflation drifting higher again, interest rate speculation, and global conflicts, it is difficult to predict if this year will follow historical norms.
Sources: CNBC.com, Globe and Mail, Financial Post, Bloomberg, Thomson Reuters, Richardson Wealth, Carson Investment Research, YCharts, FactSet
©2024 Milestone Wealth Management Ltd. All rights reserved.
DISCLAIMER: Investing in equities is not guaranteed, values change frequently, and past performance is not necessarily an indicator of future performance. Investors cannot invest directly in an index. Index returns do not reflect any fees, expenses, or sales charges. Opinions and estimates are written as of the date of this report and may change without notice. Any commentaries, reports or other content are provided for your information only and are not considered investment advice. Readers should not act on this information without first consulting Milestone, their investment advisor, tax advisor, financial planner or lawyer. This communication is intended for Canadian residents only and does not constitute as an offer or solicitation by anyone in any jurisdiction in which such an offer is not allowed.