Market Insights: April Market Correction and Outlook
Milestone Wealth Management Ltd. - May 03, 2024
Macroeconomic and Market Developments:
- North American markets were mixed this week. In Canada, the S&P/TSX Composite Index declined 0.10%. In the U.S., the Dow Jones Industrial Average rose 1.14% and the S&P 500 Index increased 0.55%.
- The Canadian dollar devalued this week, closing at 73.07 cents vs 73.16 USD last week.
- Oil prices dropped this week. U.S. West Texas crude closed at US$78.04 vs US$83.66 last week.
- The price of gold waned this week, closing at US$2,301 vs US$2,338 last week.
- Coca-Cola Co. (KO) topped consensus earnings and issued a more optimistic 2024 forecast. Organic revenue, which excludes the impact of currency shifts and acquisitions, rose 11% in the quarter, above the average analysts’ estimate. Coca-Cola sees that same measure growing as much as 9% for the full year, up from the previous range of 6% to 7% and higher than the average estimate.
- Loblaw Companies (L) reported profit rose higher-than-expected in the first quarter thanks to higher sales at the company's food retail business. The company's food retail segment, its largest, rose at a higher rate than a year earlier, at 3.4% compared with 3.1%. Meanwhile, its drug retail business operating under the Shoppers Drug Mart banner rose by 4%, down from a growth rate of 7.4% last year.
- Barrick Gold (ABX) reported an increase in first-quarter adjusted net earnings that exceeded analyst estimates. Gold production in the quarter amounted to 940,000 ounces, down from 952,000 in the same quarter last year, while copper production totalled 40,000 tonnes, unchanged from a year earlier. Barrick realized US$2,075 per ounce of gold in the quarter, up from US$1,902 in the same quarter last year, and US$3.86 per pound of copper, down from $4.20 per pound a year earlier.
- In its most recent quarterly earnings report, Apple (AAPL) managed to beat analysts' estimates despite facing some challenges. While the company's revenue saw a slight decline, its profits exceeded projections, posting earnings of $1.53 per share on revenue of $90.75 billion, exceeding analysts’ estimates of earnings of $1.50 per share on revenue of $90.01 billion. The iPhone maker also announced Thursday it would repurchase $110 billion of its shares, the biggest buyback in U.S. history, surpassing Apple’s prior repurchases.
- TC Energy (TRP) continues to anticipate lower earnings this year as it pushes forward with plans to divest assets. In the first quarter, the company's profit declined despite a rise in revenue. First-quarter revenue grew by 8% to C$4.24 billion, in line with the consensus estimate. TC Energy has advanced its program to offload around C$3 billion in assets this year agreeing to sell the East Coast natural gas transporter Portland Natural Gas Transmission System to BlackRock, which is expected to generate pre-tax proceeds of roughly C$1.1 billion.
- Nonfarm payrolls in the US increased by 175,000 on the month, below the 240,000 estimates. The unemployment rate ticked higher to 3.9% against expectations it would hold steady at 3.8%. A more encompassing jobless rate that includes discouraged workers and those holding part-time jobs for economic reasons edged up to 7.4%, its highest level since November 2021. Markets reacted positively to this news as a potential factor for the Fed starting to lower interest rates.
- Also in the US, the ISM Non-Manufacturing index declined to 49.4 in April, well below the consensus expected 52.0. (Levels above 50 signal expansion; levels below signal contraction). The services index missed consensus expectations and fell into contraction territory for the first time in sixteen months. Although the service sector has not matched the same weakness as the manufacturing sector (which has posted readings below 50 in seventeen of the last eighteen months), activity has been softening lately.
Weekly Diversion:
Check out this video: Dog Throws Out Owner's Stuff
Charts of the Week:
After five consecutive months of strong returns, the S&P 500 Index turned negative for the month of April as markets soured on the idea of fewer central bank rate cuts driven by stronger than expected inflation and employment data. However, there is reason for optimism moving forward.
The first chart highlights the S&P 500 monthly winning streaks of +1% dating back to WWII. The current streak just ended at five months. While longer winning streaks have been relatively uncommon, the data shows that market conditions don’t necessarily turn bearish when they end. In fact, the median returns for the S&P 500 in the one-, three-, six-, and twelve-months following the end of prior five-month winning streaks of 1%+ gains have been better than the average for all periods. Additionally, the S&P 500 was higher 100% of the time in the three- and six-months after the prior streaks ended, with median gains of 5.1% and 13.1%, respectively. The second chart illustrates the performance of the S&P 500 after a five-month or more winning streak break as well as providing positivity rates for one-, three-, six-, and twelve-month periods.
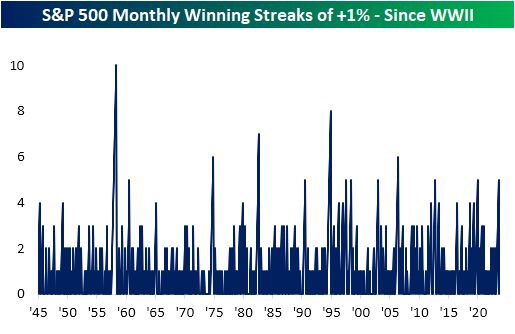
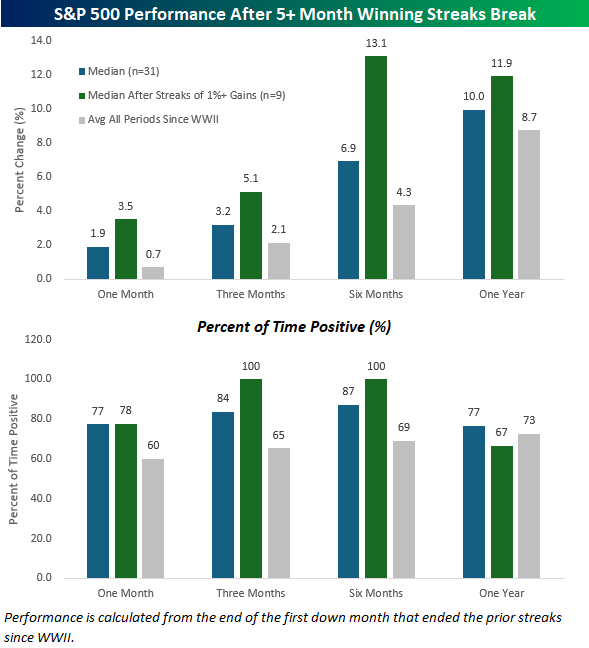
Source: Bespoke Investment Group
Shifting perspectives, the S&P 500 recently experienced back-to-back daily occurrences of the index declining 0.50% or more in the final ten minutes of trading this week, which has only happened nine times since 1985. As we can see in the next chart, most of these back-to-back declines came late in a market pullback. When looking at the performance of the S&P 500 following these rare instances, the results are mixed in the short-term, but consistently strong six- and twelve-months later, average gains of 8.1% and 21.4%, respectively. Perhaps most impressive is that one year later, the S&P 500 was higher all nine times. The last table below highlights this data.
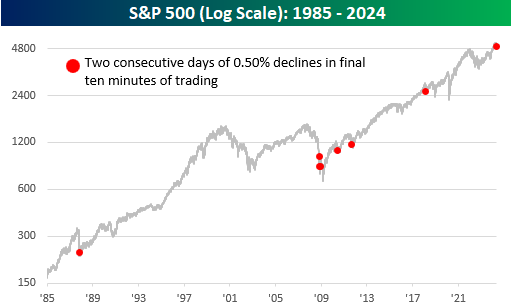
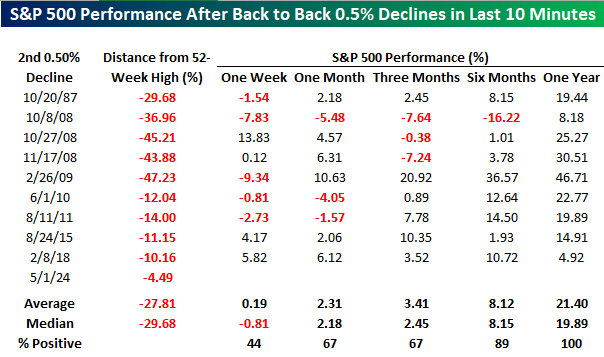
Source: Bespoke Investment Group
Sources: CNBC.com, Globe and Mail, Financial Post, Bloomberg, Thomson Reuters, Richardson Wealth, Bespoke Investment Group
©2024 Milestone Wealth Management Ltd. All rights reserved.
DISCLAIMER: Investing in equities is not guaranteed, values change frequently, and past performance is not necessarily an indicator of future performance. Investors cannot invest directly in an index. Index returns do not reflect any fees, expenses, or sales charges. Opinions and estimates are written as of the date of this report and may change without notice. Any commentaries, reports or other content are provided for your information only and are not considered investment advice. Readers should not act on this information without first consulting Milestone, their investment advisor, tax advisor, financial planner or lawyer. This communication is intended for Canadian residents only and does not constitute as an offer or solicitation by anyone in any jurisdiction in which such an offer is not allowed.