Market Insights: First Quarter Wrap-up
Milestone Wealth Management Ltd. - Apr 12, 2024
*For PDF Version, please click here*

Key Updates on the Economy & Markets
Stocks continued their upward trajectory in early 2024. The S&P/TSX Composite finally reached a new all-time price high right near the end of this first quarter, breaking the previous high from almost exactly two years ago. On a total return basis, however, the new all-time high occurred at the very end of 2023. The S&P 500 returned more than 10% for a second consecutive quarter, setting multiple new all-time price highs along the way. Notably, this quarter saw a significant shift in sentiment, as investors now only expect three interest rate cuts this year as compared to six at the start of the year. This change in expectations came as inflation progress slowed and the U.S. economy continued to expand despite higher interest rates, both of which signal a need for fewer rate cuts. This letter recaps the first quarter, discusses the stock market’s strong start to 2024, and looks ahead to the second quarter.
S&P 500 Sets 22 New All-Time Highs in Q1
The stock market is off to a strong start this year, with the S&P 500 Index gaining +10.16% in the first quarter. Figure 1 graphs the price of the S&P 500 Index from the end of 2021. The yellow dots mark new all-time closing highs. On the far-left side of the chart, the single yellow dot marks the previous all-time closing high set on January 3rd, 2022. Shortly after the January 2022 all-time high, the Federal Reserve (Fed) started its campaign of aggressive interest rate hikes as inflation spiked to a 40-year high. The chart shows the 2022 stock market selloff as investors feared that higher interest rates would slow the economy.
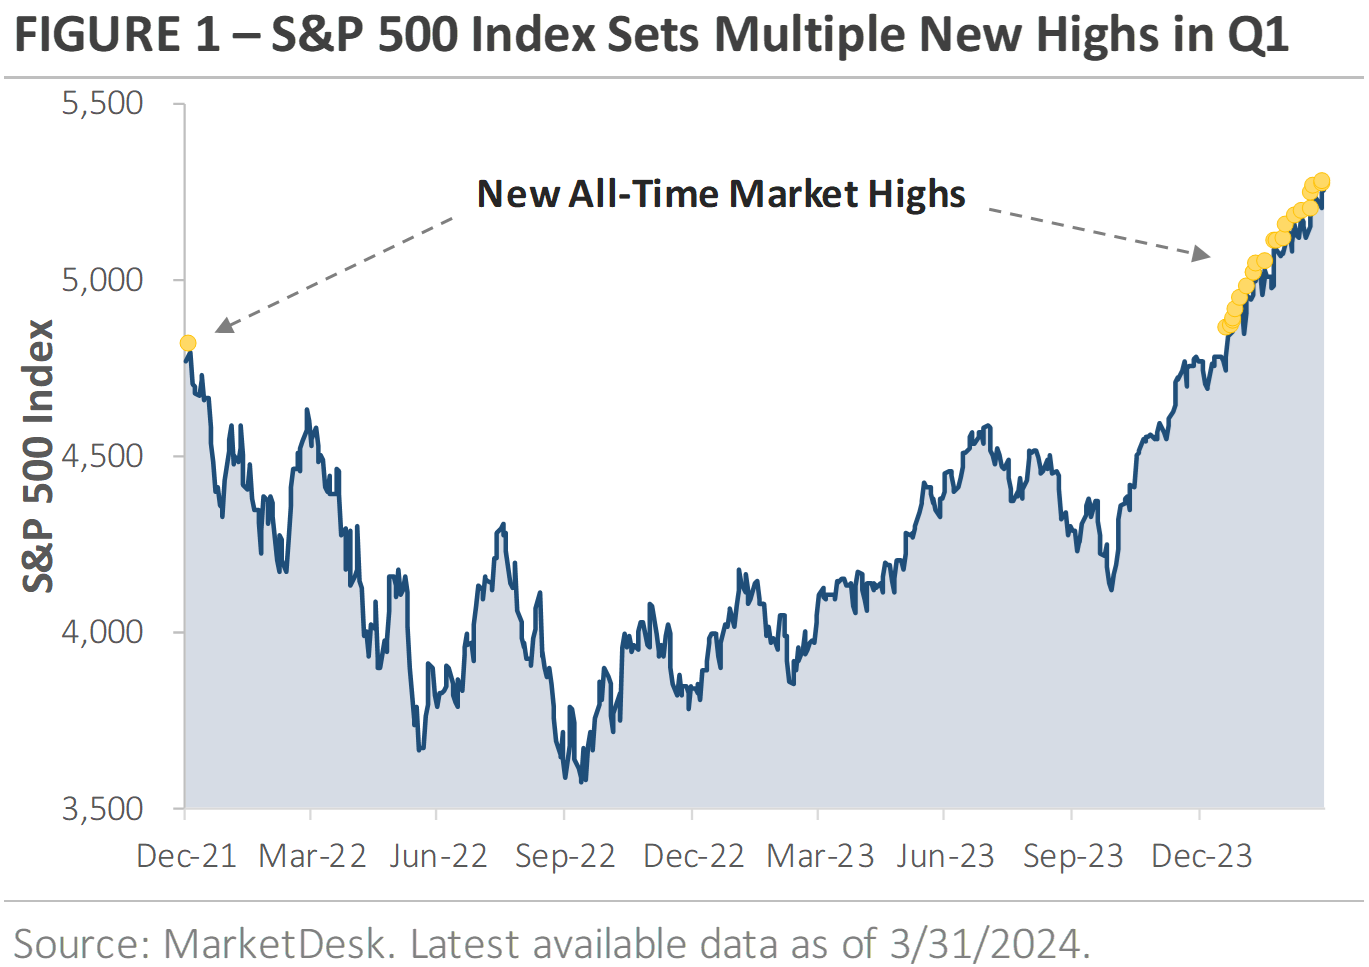
The January 2022 all-time closing high held throughout all of 2022 and 2023, but it’s already been eclipsed multiple times in 2024. After trading below its prior all-time high for over two years, the S&P 500 Index has set 22 new all-time closing highs this year. The yellow dots on the far-right side of the chart mark these new highs and show the S&P 500’s steady climb higher in early 2024.
This strong upward trajectory for the past year has been led by the rebounding U.S. large cap technology sector which has had an impressive run the last year and a half. A handful of names have become an ever-larger proportion of the market capitalization, resulting in a Tech-heavy and often volatile index. From an equal-weighted perspective, or how the average stock has performed, the S&P 500 only just reached a new all-time high in early March. Since the end of 2021, the market cap-weighted S&P 500 Index has outperformed the S&P 500 Equal Weight (EW) Index by a whopping 17.7%. However, even with this strong push, over the longer-term, since the creation of the S&P 500 EW Index over 20 years ago in January of 2003 , it has still outperformed the S&P 500 over that period. This is the same for the last 15-year period as well since the end of the Great Recession.
Inflation Progress Slowed in Q1
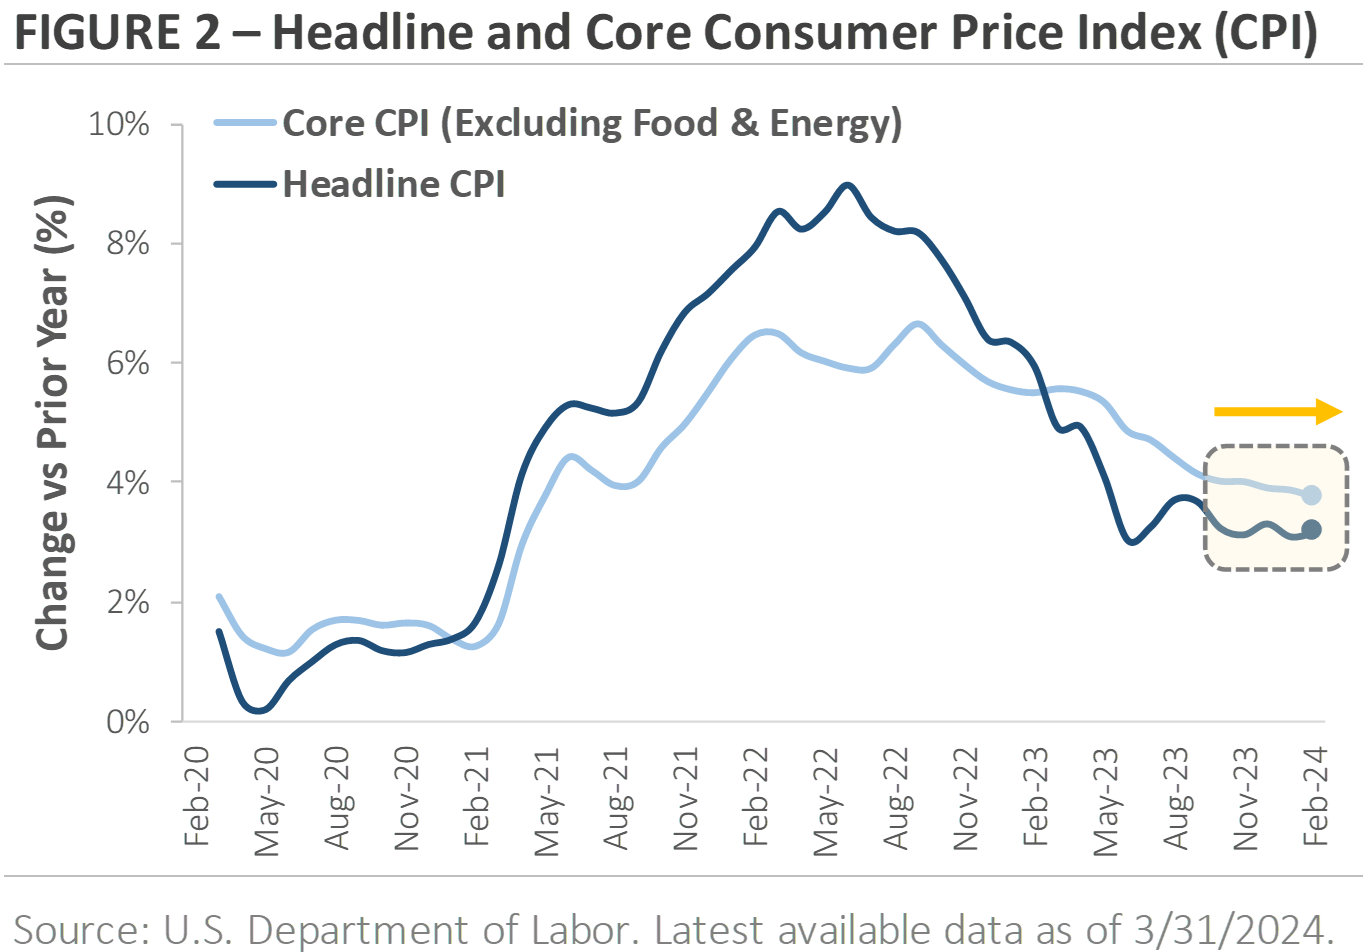
Inflation was on a steady downward trend heading into this year, and the market expected it to continue moving lower. However, recent data is causing investors to rethink that assumption. Figure 2 graphs the year-over-year change in the U.S. Consumer Price Index, which measures the change in price for a basket of consumer goods. The chart shows the inflation spike in 2021 and early 2022, followed by a period of easing inflation during the past two years. However, the yellow box shows that the pace of inflation progress has slowed recently. While inflation is still drifting lower, it’s not falling as quickly as investors or the Fed want.
The question is whether the slowing progress is the start of a new trend or a temporary break in the current trend. Seasonality may be contributing to the slowdown, as inflation tends to be higher earlier in the year and then lower later in the year. Is the early 2024 rise the result of previously agreed upon contractual price increases, or does it hint at something more under the surface? Fed Chair Jerome Powell believes the early 2024 inflation bump is seasonal and short-term in nature. The market is less certain and more divided.
The chart also demonstrates that getting back to the Fed's 2% inflation target will be bumpy and uneven. The disinflation process won’t be a straight line. The latest risk is rising oil prices, with the price of a regular gallon of gasoline jumping by over +20% during Q1. Falling energy prices helped to ease inflation pressures during the past two years, but there is now a question about whether that trend can continue with gas prices rising.
Investors Expect Fewer Interest Rate Cuts This Year
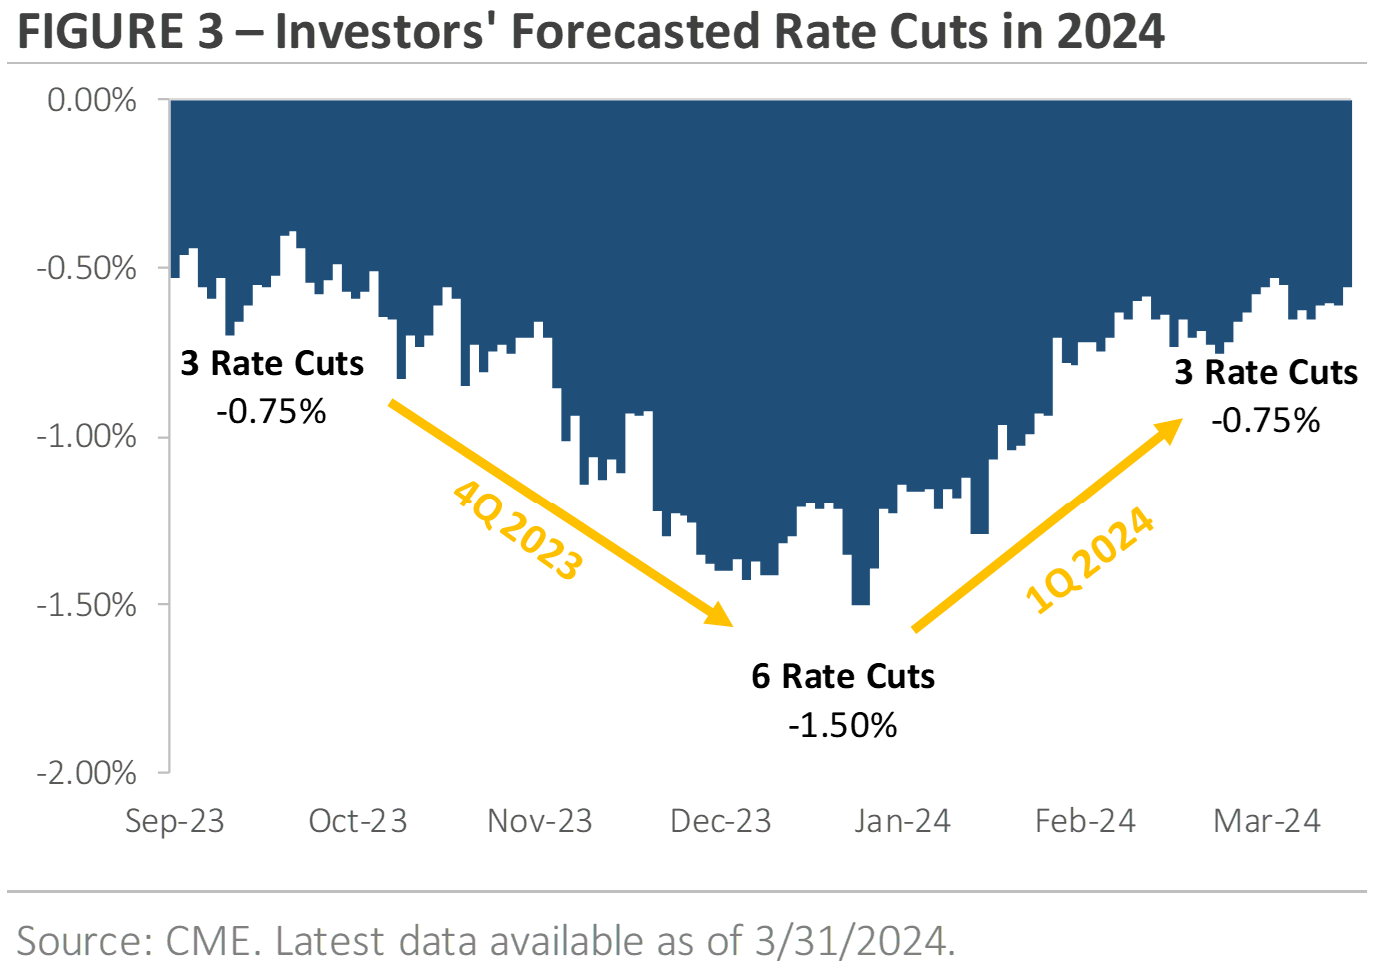
One of the big debates heading into 2024 was how many times the Fed would cut interest rates. Figure 3 tracks the market’s rate cut forecast. Looking back to the start of Q4 2023, the market expected the Fed to cut interest rates by -0.75% this year. By the end of December, the market’s rate cut forecast for the entirety of 2024 had risen to -1.50%. Based on a typical rate cut increment of -0.25%, investors came into this year expecting six interest rate cuts (i.e., -1.50% in total cuts). In contrast, the Fed only expected three interest rate cuts at the start of this year, or half the market’s estimate. There was a debate over whose interest rate cut forecast was more accurate. As of the end of Q1, the central bank’s forecast appears more accurate. Investors now only expect three interest rate cuts this year, which is in line with the Fed's initial forecast.
Why do investors expect fewer interest rate cuts this year? One reason is that inflation progress is slowing. Another reason is that the U.S. economy remains resilient despite higher rates. The next page’s Figure 4 graphs three data points that underscore this resilience. The top chart graphs the number of new U.S. homes for sale by stage of construction: not started; under construction; and completed. The chart shows home construction activity is at levels not seen since before the 2008 financial crisis, despite the average 30-year fixed-rate mortgage sitting near a 15-year high of 7%.
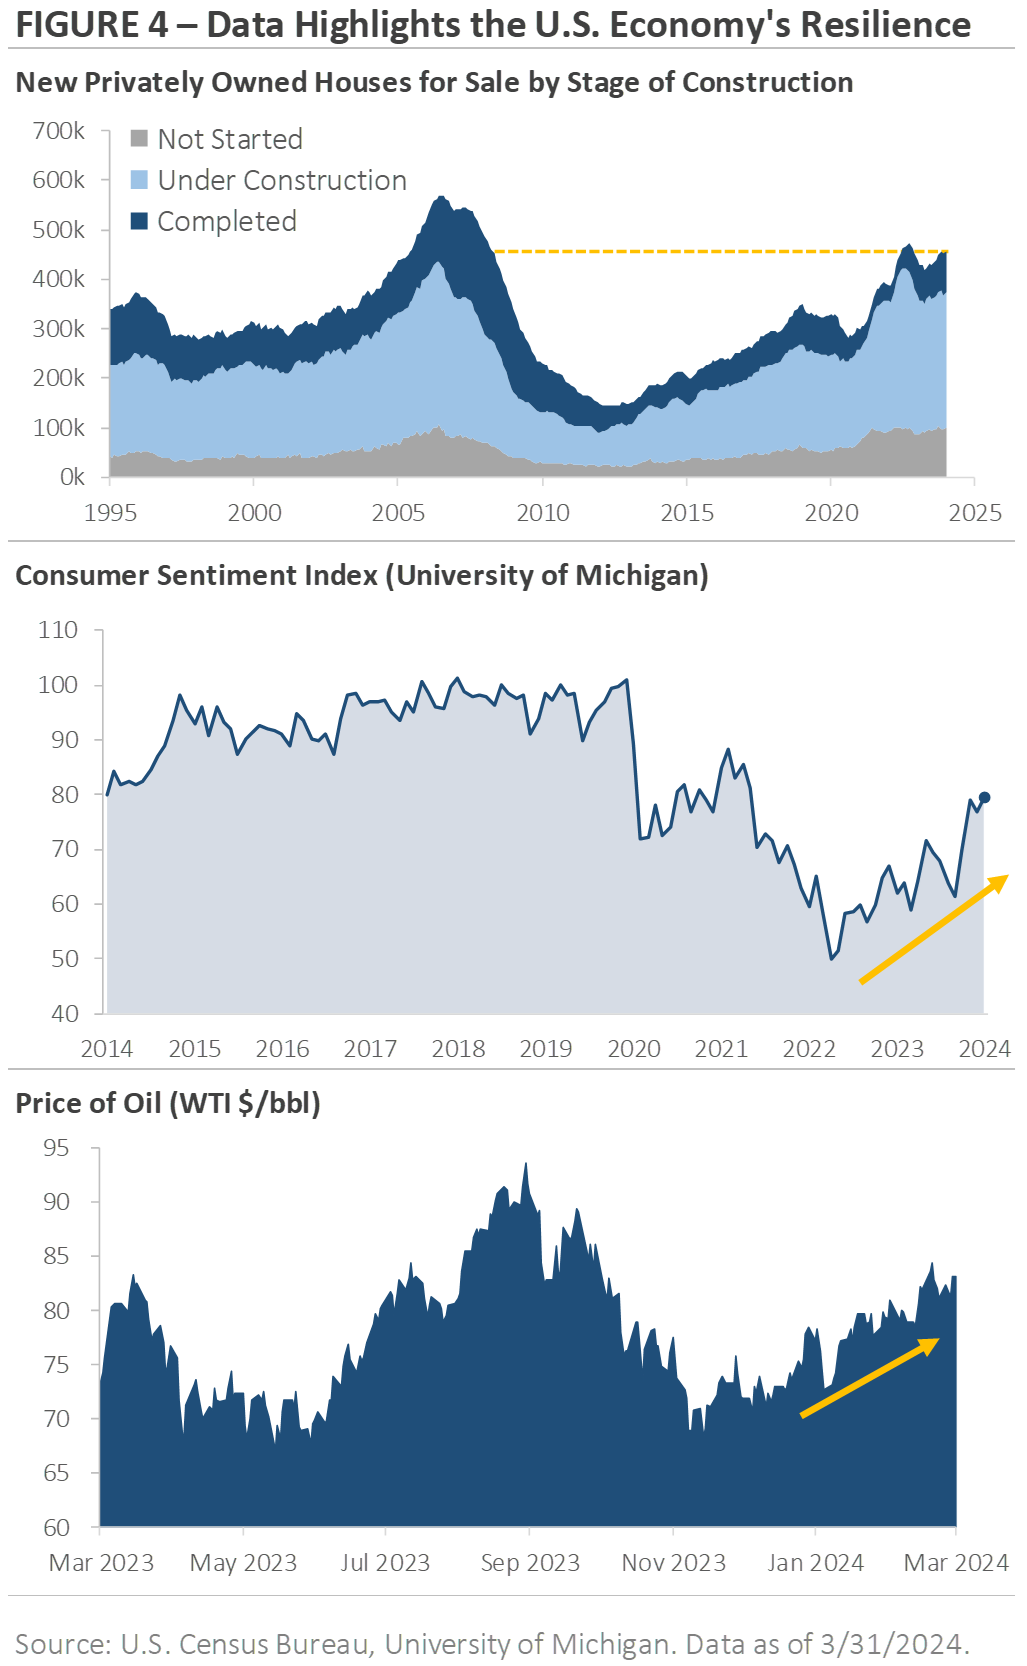
The middle section shows U.S. consumer sentiment rose to a 2.5-year high in March after setting a record low in June 2022. Multiple factors are contributing to the improved sentiment, including a tight labor market, rising stock prices and home values, expectations for a continued decline in inflation, and a solid economic backdrop. The bottom chart tracks the price of a barrel of West Texas Intermediate crude. Crude oil prices have risen from approximately $70 per barrel at the start of the year to $83 per barrel at the end of Q1, an increase of roughly +18.5%. Oil is a cyclical commodity, so rising oil prices suggest demand is strong and may hint at underlying strength in the U.S. economy.
Equity Market Recap – Stocks Post a Second Consecutive Quarter of Strong Gains
The opening section discussed the stock market’s strong start to the year. Following an impressive +11.6% gain in Q4, the S&P 500 returned +10.4% in Q1. Small cap stocks underperformed during the quarter, as the Russell 2000 Index returned +5.0%. Ten of the eleven S&P 500 sectors posted gains, with cyclical sectors outperforming their defensive counterparts. The energy, financial, and industrial sectors each outperformed the broader S&P 500 Index, while the real estate, utility, and consumer staple sectors underperformed as the stock market rallied. In Canada, the S&P/TSX Composite advanced 5.77%. As opposed to the U.S., the S&P/TSX Small Cap index outperformed the large cap index with a price gain of 7.23%. However, it has underperformed Canadian large caps by a significant margin over the last while and has yet to reach a new all-time price high.
International stocks underperformed U.S. stocks for a fourth consecutive quarter during Q1. Over the past twelve months, the MSCI EAFE Index of developed market stocks has returned +14.8%, or roughly half of the S&P 500’s +29.4% return. The MSCI Emerging Market Index has returned only +6.8%, or approximately one-fourth of the S&P 500. A few themes may explain why international stocks continue to underperform. First, international stock market indices lack exposure to leading artificial intelligence companies like Microsoft, Nvidia, and Super Micro Computer. Second, as discussed above, the U.S. economy continues to expand despite higher rates. In contrast, some countries and regions outside the U.S. are already feeling the effect of higher interest rates. Investors have been attracted to the U.S. for both its AI exposure and relative economic strength.
Credit Market Recap – Bonds Trade Lower After a Strong Fourth Quarter
While stocks started the year off with strong gains, bonds traded lower during Q1. The losses came as investors realized that the continued resilience of the U.S. economy meant the Fed may not need to cut interest rates as much, which caused Treasury yields to rise. The Bloomberg U.S. Bond Aggregate Index, which tracks a broad index of investment-grade rated bonds, posted a return of -0.7%. It was a sharp reversal from Q4, when the index posted its first quarterly gain since Q1 2023 and its biggest quarterly gain since 1989. It has been even worse in Canada, with the aggregate index down 1.34% YTD.
In the corporate bond category, investment-grade bonds underperformed high-yield bonds during Q1. Over the past twelve months, high-yield U.S. corporate bonds have generated a total return of +8.8%, which factors in the interest payments received. Investment-grade corporate bonds generated a +3.5% total return over the same period. The high-yield bond universe continues to benefit from multiple themes. First, the group yields 7.83% at the end of Q1, which is 2.45% higher than investment-grade bonds. This extra yield helps boost high-yield’s total return. Second, as Figure 4 highlights, the U.S. economy has remained resilient despite higher interest rates. With the U.S. economy expanding at a solid pace, high-yield bonds’ credit risk has remained stable, limiting the number of defaults.
Second Quarter Outlook – Themes to Watch
The big investment themes were mostly unchanged during the first quarter. Stocks continued to trade higher, and the U.S. economy remained in expansion mode. While the market now expects fewer interest rate cuts this year, the primary reason is that investors and the Fed believe the U.S. economy can handle higher interest rates. Economic theory suggests that higher interest rates should slow economic activity as the cost of capital increases, but the data tells a different story this cycle. Home construction activity is the strongest since before 2008, consumer sentiment recently hit a 2.5-year high, and unemployment remains below 4%.
It’s difficult to overstate the uniqueness of this economic cycle. There was unprecedented monetary and fiscal stimulus in 2020 and 2021, followed by a rapid rise in interest rates in 2022 and 2023 as inflation reached levels not seen since the 1970s. In the U.S. housing market, many homeowners locked in low long-term mortgage rates during the past few years, which has effectively limited the impact of rising interest rates. The labor market remains relatively tight after five million U.S. workers left the labor force during the pandemic and didn’t return, which has not been seen before. These themes won’t reverse quickly and will have long-lasting effects, which both the Fed and markets must navigate. We will continue to monitor financial markets and the economy, provide timely updates to you, and adjust portfolios as needed.
Thank you for your continued trust in Milestone and for the opportunity to assist you in working toward your financial goals. We understand the risks facing both the markets and the economy and are committed to helping you effectively navigate this relatively unique and challenging investment environment. Successful investing is a marathon, not a sprint, and even intense volatility is unlikely to alter a diversified approach set up to meet your long-term investment goals. Therefore, it’s critical to stay invested, remain patient, and stick to the plan, as we’ve worked with you to establish a unique, personal allocation target based on your financial position, risk tolerance, and investment timeline.
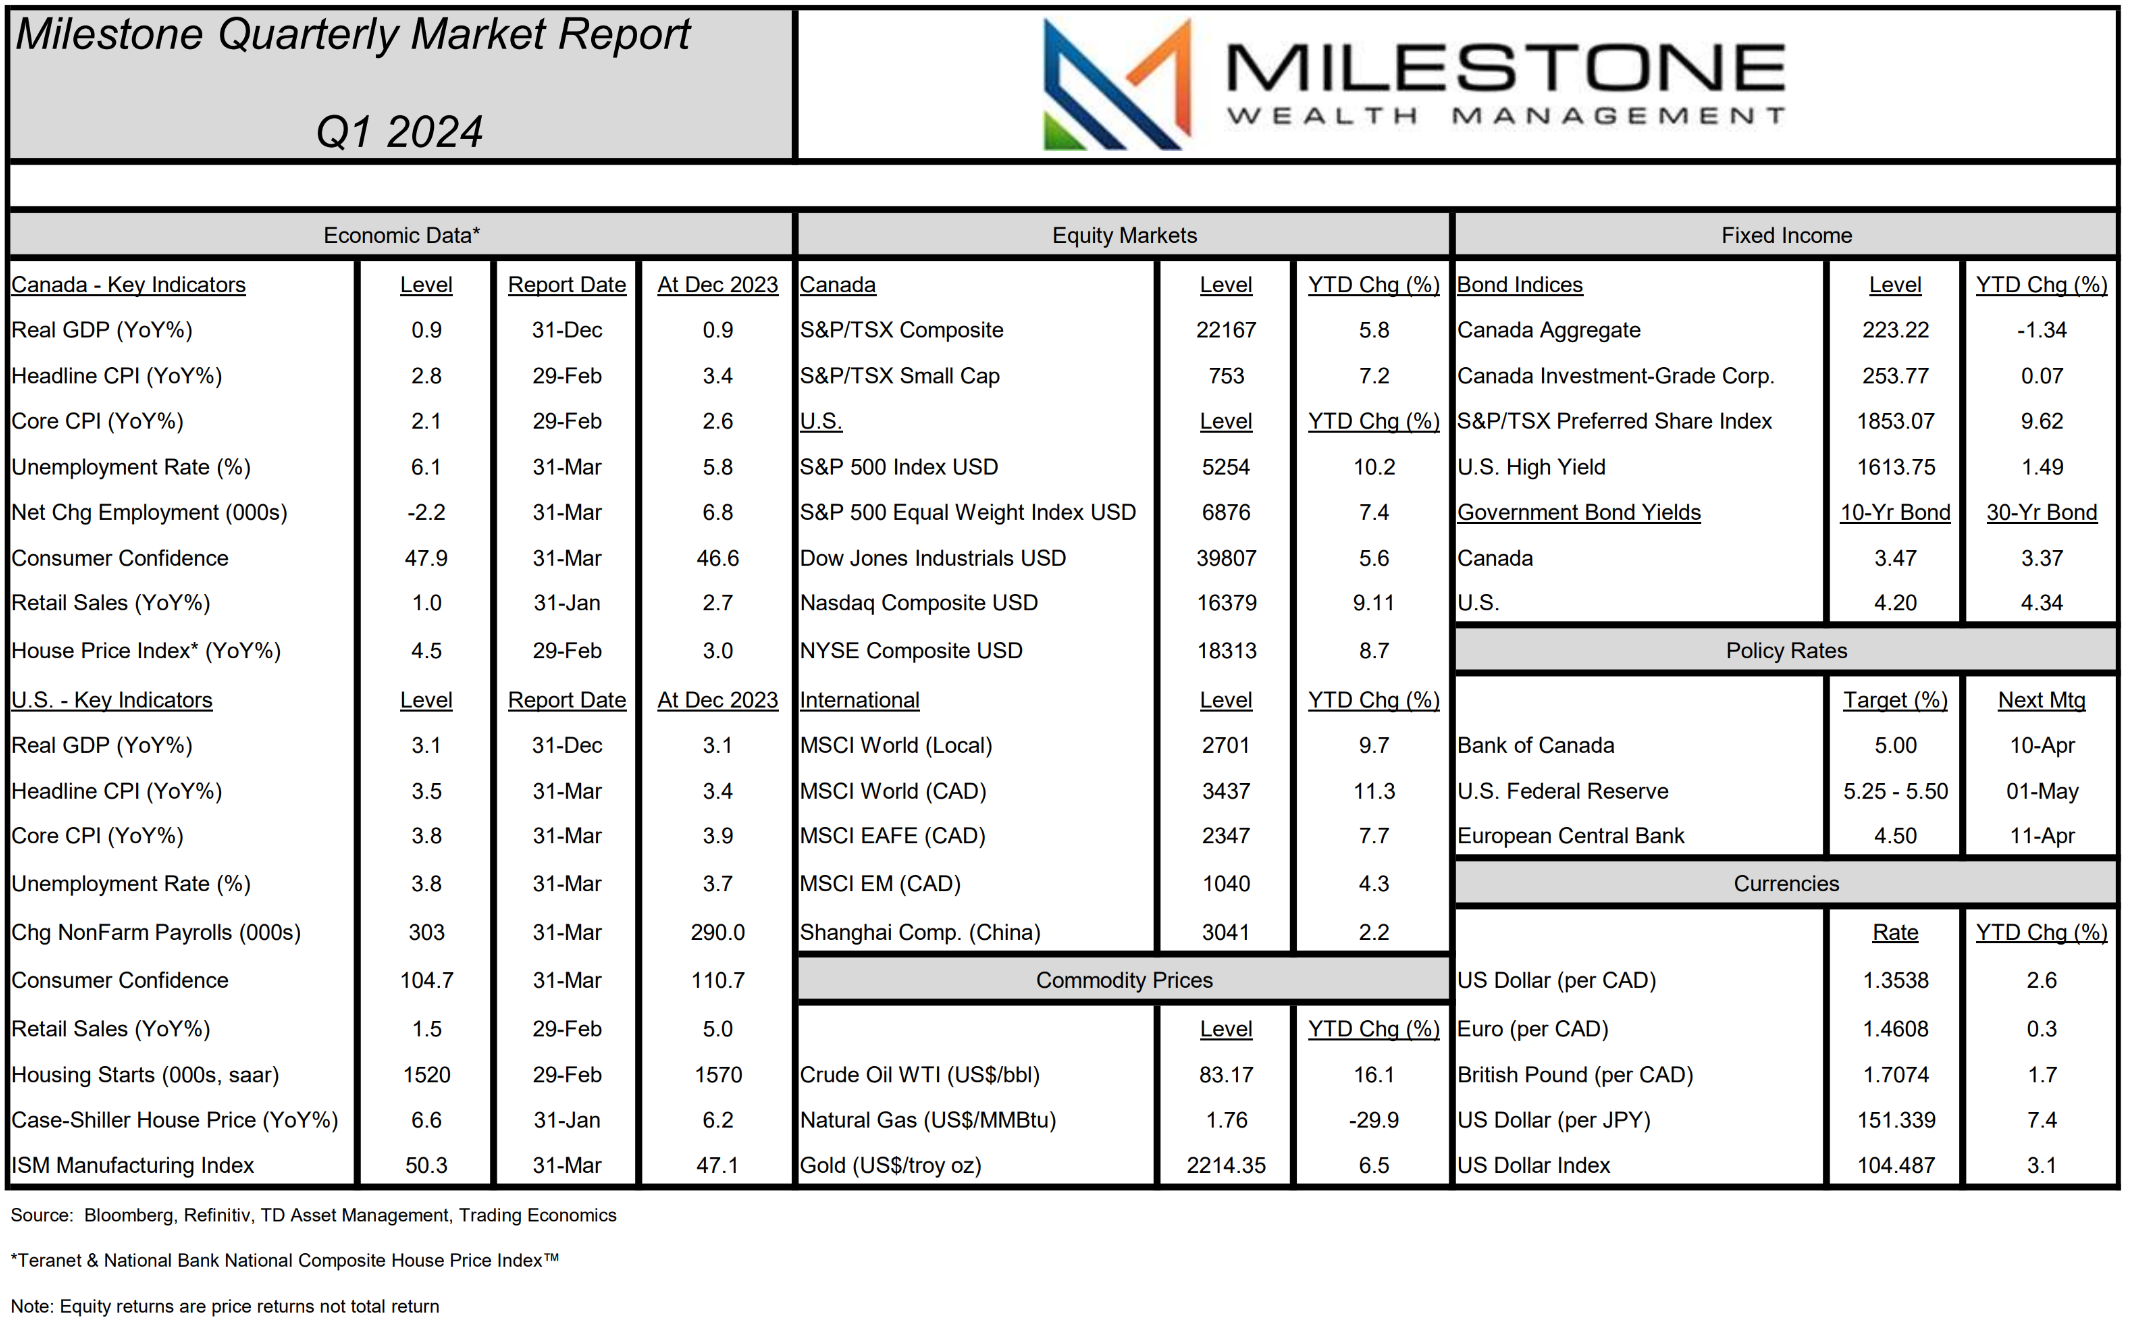
Here is our quarterly Market Report on economic data, capital markets, commodities, and currencies through March 31st, 2024:
*Click image for full PDF*
Disclosure:
Investing in equities is not guaranteed, values change frequently, and past performance is not necessarily an indicator of future performance. Investors cannot invest directly in an index. Index returns do not reflect any fees, expenses, or sales charges. Opinions and estimates are written as of the date of this report and may change without notice. Any commentaries, reports or other content are provided for your information only and are not considered investment advice. Readers should not act on this information without first consulting Milestone, their investment advisor, tax advisor, financial planner, or lawyer. This communication is intended for Canadian residents only and does not constitute as an offer or solicitation by anyone in any jurisdiction in which such an offer is not allowed.
Sources: Thomson Reuters, Bloomberg, Refinitiv, TD Asset Management, Trading Economics, Teranet and National Bank of Canada, Barchart, MarketDesk Research LLC, Standard & Poors, Dow Jones, U.S. Census Bureau, University of Michigan, U.S Department of Labor, Chicago Mercantile Exchange.
©2024 Milestone Wealth Management Ltd. All rights reserved.