Market Insights: S&P 500 New Record Highs & Future Performance
Milestone Wealth Management Ltd. - Mar 22, 2024
Macroeconomic and Market Developments:
- North American markets were positive this week. In Canada, the S&P/TSX Composite Index rose 0.62%. In the U.S., the Dow Jones Industrial Average increased 1.97% and the S&P 500 Index rallied 2.29%.
- The Canadian dollar fell this week, closing at 73.50 cents vs 73.85 cents last Friday.
- Oil prices were slightly negative this week. U.S. West Texas crude closed at US$80.86 vs US$81.04 last Friday.
- The price of gold jumped this week, closing at US$2,165 vs US$2,157 last Friday.
- The U.S. Federal Reserve was in the spotlight this week, with the central bank electing to hold its overnight interest rate at a range of 5.25% - 5.50% and reiterating its expectation for three rate cuts this year. The Fed stated “recent indicators suggest that economic activity has been expanding at a solid pace. Job gains have remained strong, and the unemployment rate has remained low. Inflation has eased over the past year but remains elevated.”
- Canada’s annual inflation rate, as measured by the Consumer Price Index, fell to 2.8%, surprising economists that were expecting the rate to rise to 3.1%. The big drop came from wireless services (down 26.5%) and internet prices (down 13.2%). Meanwhile, Canadian Retail Sales declined 0.3% in January, slightly better than the estimate for a 0.4% monthly drop.
- The U.S. government is awarding Intel (INTC) approximately $20 billion in grants and potential loans, including up to $8.5 billion in direct funding through the CHIPS and Science Act. The funds will advance Intel's commercial semiconductor projects across Arizona, Ohio, New Mexico and Oregon.
- Reddit, the 19-year-old website that hosts millions of online forums, priced its IPO on Wednesday at $34.00/share, the top of the expected range, bringing in $519 million. The stock started trading under the symbol RDDT on Thursday and finished the first day of trading up 48.35%
- Shares of Lululemon (LULU) dropped 15.80% on Friday despite reporting strong holiday-season earnings of $669.50 million or $5.29/share vs $5.00/share expected. However, the company lowered its full-year guidance for sales growth to only 11 – 12%, disappointing investors.
Weekly Diversion:
Check out this video: Extreme Kayaking
Charts of the Week:
From an investment perspective, 1995 was a remarkable year with the S&P 500 Index recovering from early setbacks to achieve 77 record highs, experiencing minimal downside volatility. The market parallels between 1994 - 1995 and today are evident, with the S&P 500 having already notched 17 new highs.
The chart below highlights the number of S&P 500 record highs as well as the max drawdown in those years. The chart also highlights the average max drawdown when there are no record highs and the average max drawdown when there are record highs. As we can see, the average max drawdown is significantly lower when record highs have been achieved in the year.
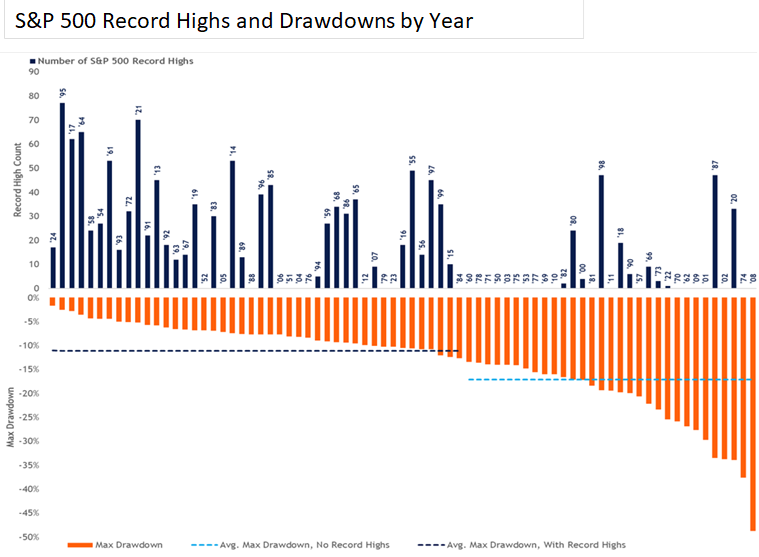
Source: Adam Turnquist via Advisor Analyst
This week, the index also accomplished an impressive feat as not only was there a 52-week high in the percentage of S&P 500 stocks hitting 52-week highs, but the S&P 500 also hit a 52-week high on an intraday basis. Since 1991, there have only been 47 other days where both milestones were achieved on the same day. The chart below summarizes the S&P 500’s average performance following all days since 1991 when the index made a new high in price (grey bar), when the percentage of components trading at a new high hit a 52-week high (orange bar), when both readings made a 52-week high (green bar), and finally, all other days (blue bar). As we can see, in the short-term (1 week to 3 months), the average return after this occurrence is nothing special; however, when we move to longer-term outlooks, this improves drastically posting an average return of 5.66% 6-months out and 12.87% one year out, both outpacing the other averages.
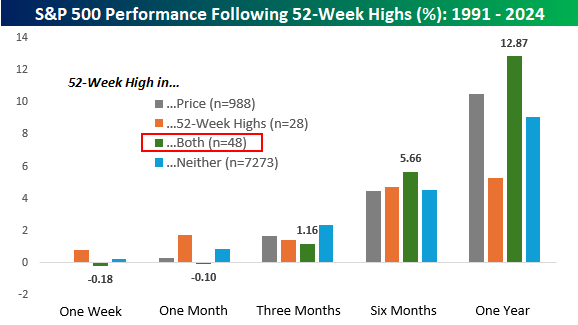
Source: Bespoke Investment Group
Reflecting on historical data, years with record highs like 1995 tend to exhibit less downside volatility compared to other years. Investors should anticipate pullbacks, but historically these have been less severe during record-high years. This suggests that despite potential corrections, the current rally may have further room for growth. The average annual returns during years with record highs have been notably higher than those without such highs, indicating a potential continuation of the current bullish trend in 2024.
Sources: CNBC.com, Globe and Mail, Financial Post, Bloomberg, Thomson Reuters, Richardson Wealth, Adam Turnquist via Advisor Analyst, Bespoke Investment Group
©2024 Milestone Wealth Management Ltd. All rights reserved.
DISCLAIMER: Investing in equities is not guaranteed, values change frequently, and past performance is not necessarily an indicator of future performance. Investors cannot invest directly in an index. Index returns do not reflect any fees, expenses, or sales charges. Opinions and estimates are written as of the date of this report and may change without notice. Any commentaries, reports or other content are provided for your information only and are not considered investment advice. Readers should not act on this information without first consulting Milestone, their investment advisor, tax advisor, financial planner or lawyer. This communication is intended for Canadian residents only and does not constitute as an offer or solicitation by anyone in any jurisdiction in which such an offer is not allowed.