Market Insights: Extreme Easing of Financial Conditions
Milestone Wealth Management Ltd. - Mar 01, 2024
Macroeconomic and Market Developments:
- North American markets were mixed this week. In Canada, the S&P/TSX Composite Index rose 0.65%. In the U.S., the Dow Jones Industrial Average decreased 0.11% and the S&P 500 Index increased 0.95%.
- The Canadian dollar was down this week, closing at 73.74 cents vs 74.03 cents USD last Friday.
- Oil prices were positive this week. U.S. West Texas crude closed at US$79.78 vs US$76.56 last Friday.
- The price of gold rallied this week, closing at US$2,083 vs US$2,035 last Friday.
- The Canadian economy expanded at an annualized rate of 1.0% in Q4 2023, following a contraction of 0.5% in Q3. The Q4 growth means the Canadian economy was able to avoid recession, which is defined as two consecutive quarters of negative Real (after inflation) GDP growth.
- The U.S. Federal Reserve’s preferred measure of inflation, the Personal Consumption Expenditures (PCE) price index, rose 0.3% in January and 2.4% from January 2023. Excluding volatile items, the Core PCE rose 0.4% for the month and 2.8% from a year ago. This are down from last month’s 2.6% and 2.9% respective yearly rates.
- Warren Buffet’s holding company Berkshire Hathaway (BRK.b) reported quarterly earnings last weekend, showing earnings jumping to $8.48 billion. The company’s hoard of cash has now risen to $167.6 billion as it continues to look for deals to put that money to work.
- Calgary-based Canadian Natural Resources (CNQ), Canada's largest oil and gas producer, hit a new all-time high this week after releasing blowout earnings. The company also increased its dividend by 5% and announced a two-for-one stock split.
- Bitcoin continued its surge this week, shooting above $60,000 for the first time since November 2021. The cryptocurrency finished the week at US$62,766.40, approaching its all-time high of $68,982.20. News of a purchase of 3,000 bitcoins (approximately $155 million) by MicroStrategy (MSTR), a Virginia-based software company and the largest publicly traded owner of bitcoin, played a significant role in the rally.
- The big banks in Canada reported earnings this week:
- Scotiabank (BNS) reported better than expected earnings of $1.69/share vs $1.61/share, on revenue of $8.43 billion vs $8.25 billion expected. The bank reported its provision for credit losses was $962 million.
- Bank of Montreal (BMO) reported lower than expected earnings of $2.56/share vs $3.02/share expected, with revenue of $7.85 billion vs $8.36 billion expected and provision for credit losses of $627 million.
- Royal Bank (RY) reported better than expected earnings of $2.85/share vs $2.79/share expected. Revenue came in at $13.49 billion vs the $13.45 billion forecast and the bank set aside C$813M in provisions for credit losses.
- CIBC (CM) reported earnings of $1.81/share vs $1.66/share expected, on revenue of $6.22 billion vs the forecast of $6.06 billion and its provision for credit losses was $585 million.
- TD Bank (TD) reported earnings of $2.00/share vs $1.93/share expected, revenue of $13.71 billion and provision for credit losses of $1.0 billion.
Weekly Diversion:
Check out this video: This looks amazing.
Charts of the Week:
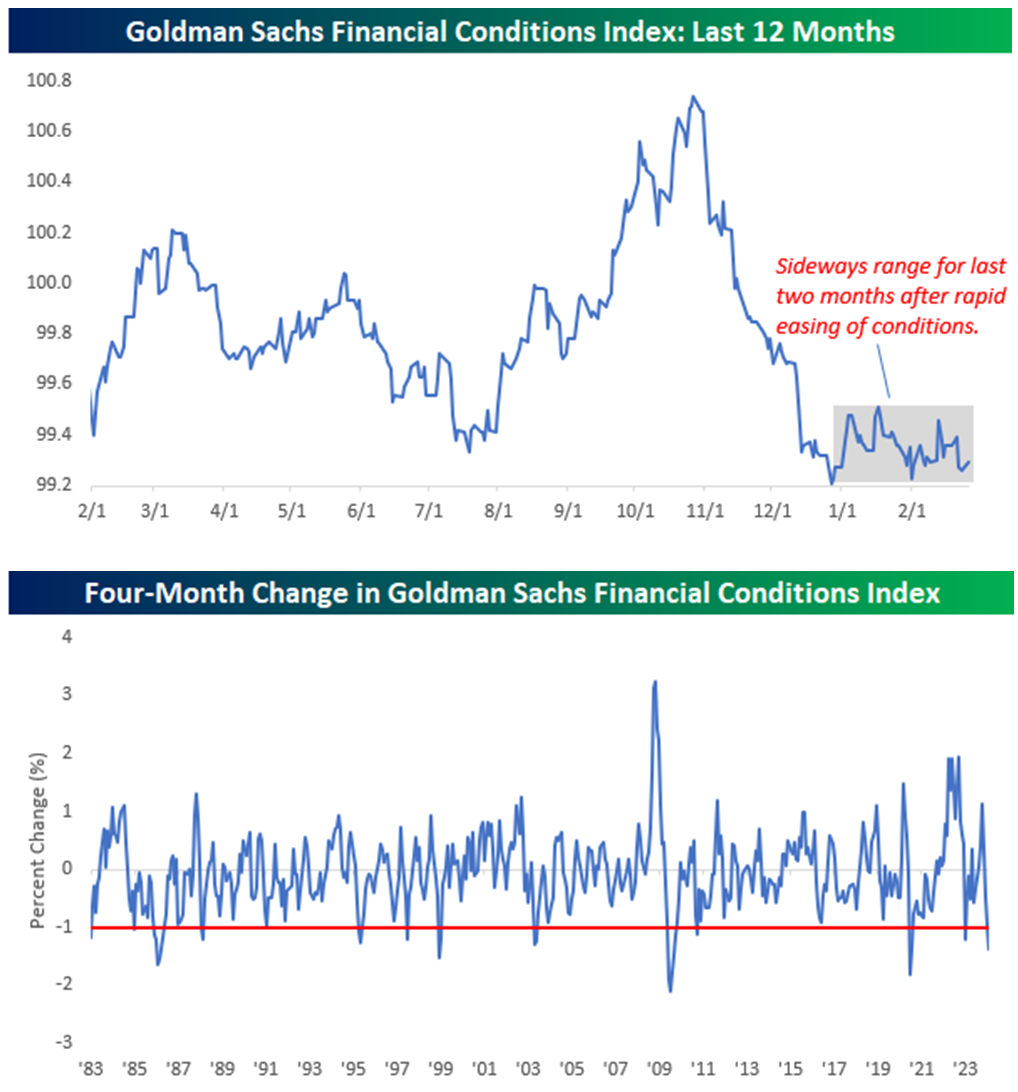
The U.S. economy has experienced a significant shift in financial conditions over the past four months, with a notable period of easing following the October low. Initially, there was a rapid easing of financial conditions, marking one of the most substantial in at least 40 years. However, the past two months we have seen a stabilization in credit conditions, showing minimal fluctuations. The first two charts below highlight the Goldman Sachs Financial Conditions (GSFC) Index over the past 12 months (monthly) and the four-month change since 1982 (annually).
This GSFC Index is a key indicator that measures how ‘loose’ or ‘tight’ financial conditions in the economy are and reflects changes in various financial variables, such as interest rates, credit spreads, and asset prices, to provide an overall assessment of the accessibility of credit and the overall health of financial markets. A lower value on the index indicates looser financial conditions, implying easier access to credit and generally favorable economic conditions, while a higher value signifies tighter financial conditions, suggesting restricted credit availability and potentially more challenging economic circumstances.
Source: Bespoke Investment Group
Despite this recent stability, the overall cumulative easing in financial conditions remains remarkable, ranking as one of the most significant periods since 1982. The recent sideways movement is particularly noteworthy given the extreme easing observed towards the end of 2023, with only the recovery from the COVID-19 crash showing more extreme easing over a four-month period.
Analyzing historical data since 1982, it is evident that periods of easing financial conditions have often been followed by strong positive market performance. Looking at prior occurrences (12) where the GSFC Index declined by at least 1% over a four-month period, the subsequent performance of the S&P 500 Index showed consistent and well above-average returns versus all periods. Notably, six months later, the S&P 500 was higher in 11 out of 12 times, with an average return of 11.2%, and one year later, it recorded gains in all instances with an average increase of 17.04%. This compares to just 4.85% and 10.1%, respectively, over all periods with less % positive years. These findings suggest that while the current market rally may reflect some pricing in of better financial conditions to this point (based on the GSFC Index), data indicates that such periods have historically led to sustained above-average equity market returns over the next year. The table below highlights these historical forward returns.
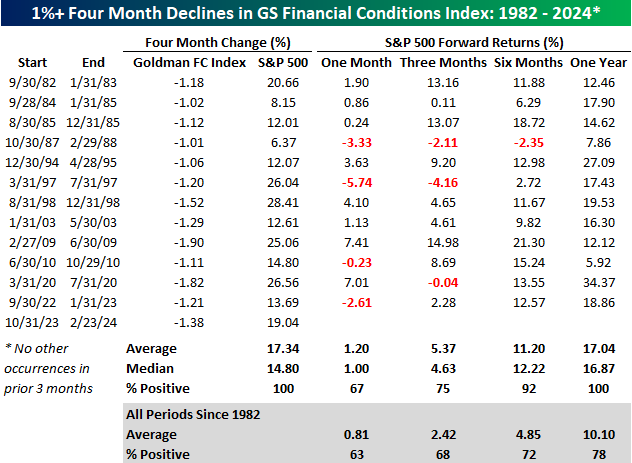
Source: Bespoke Investment Group
Sources: CNBC.com, Globe and Mail, Financial Post, Bloomberg, Thomson Reuters, Richardson Wealth, Bespoke Investment Group
©2024 Milestone Wealth Management Ltd. All rights reserved.
DISCLAIMER: Investing in equities is not guaranteed, values change frequently, and past performance is not necessarily an indicator of future performance. Investors cannot invest directly in an index. Index returns do not reflect any fees, expenses, or sales charges. Opinions and estimates are written as of the date of this report and may change without notice. Any commentaries, reports or other content are provided for your information only and are not considered investment advice. Readers should not act on this information without first consulting Milestone, their investment advisor, tax advisor, financial planner or lawyer. This communication is intended for Canadian residents only and does not constitute as an offer or solicitation by anyone in any jurisdiction in which such an offer is not allowed.