Market Insights: Nvidia Sets a Record Day
Milestone Wealth Management Ltd. - Feb 23, 2024
Macroeconomic and Market Developments:
- North American markets were positive this week. In Canada, the S&P/TSX Composite Index rose 0.74%. In the U.S., the Dow Jones Industrial Average increased 1.30% and the S&P 500 Index jumped 1.66%.
- The Canadian dollar was down slightly this week, closing at 74.03 cents vs 74.14 cents last Friday.
- Oil prices were negative this week. U.S. West Texas crude closed at US$76.56 vs US$79.23 last Friday.
- The price of gold rallied this week, closing at US$2,035 vs US$2,013 last Friday.
- Canada’s inflation rate, as measured by the Consumer Price Index (CPI), fell to 2.9% from January 2023 to January 2024, down from the 3.4% annual pace in December. Excluding volatile items, the Core CPI was 3.4%, which was in line with economists’ estimates.
- Canadian retail sales increased 0.9% to $67.3 billion in December, led by increases at motor vehicle and parts dealers (+1.9%). Statistics Canada also gave an advance estimate of retail sales showing a decrease of 0.4% in January.
- Houston-based Chord Energy (CHRD) agreed to buy Enerplus (ERF) for US$3.7 billion in stock and cash, with investors receiving $1.84/share plus 0.10125 shares of Chord. The deal will take Chord’s production up to the equivalent of 287,000 barrels of oil per day with a total 1.3 million net acres in the Williston Basin.
- Capital One Financial (COF) has announced plans to acquire Discover Financial Services (DFS) in a $35.3 billion all-stock deal. Under the terms of the deal, Discover shareholders will receive 1.0192 Capital One shares and Capital One shareholders will hold nearly 60% of the combined firm.
- S&P Dow Jones Indices announced Tuesday that Amazon (AMZN) will replace Walgreens (WBA) in the Dow Jones Industrial Average, effective next week. The swap is an effort to rebalance the price-weighted measurement of the 30-stock index with increased consumer retail exposure after Walmart’s 3-for-1 stock split lowered its weight.
- All eyes were on Nvidia (NVDA) this week; expectations were very high and the company did not disappoint investors. The company reported quarterly earnings of $5.15/share vs $4.64/share expected, on revenue of $22.10 billion, an increase of 265% from a year ago, vs $20.62 billion expected. Nvidia has been the primary beneficiary of the recent surge in demand for its graphics processors due to excitement surrounding AI.
Weekly Diversion:
Check out this video: Behind the scenes at the filming of the DunKings Super Bowl commercial.
Charts of the Week:
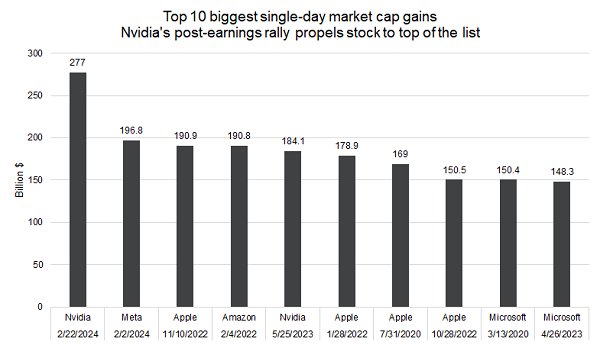
We have previously discussed the Magnificent Seven companies (also known as the Mag 7 – Alphabet, Amazon, Apple, Meta, Microsoft, Nvidia, and Tesla), and the effect these companies have had on the S&P 500 Index, especially in the past year. As we noted above in today’s market developments, Nvidia reported quarterly earnings yesterday that blew past expectations and sent the stock soaring. As of today’s close, the stock is up 63.63% YTD. Perhaps more impressively, the increase in market capitalization (cap) for Nvidia broke the daily record previously set by META earlier this year on February 2nd. The chart below illustrates that the market cap for Nvidia rose $277 billion in one day, far exceeding the previous record of $196.8 billion by Meta. The chart also points to the strength that technology companies have had, with the ten largest single-day market cap gains all being set by five of the seven Mag 7 companies.

Source: Bloomberg
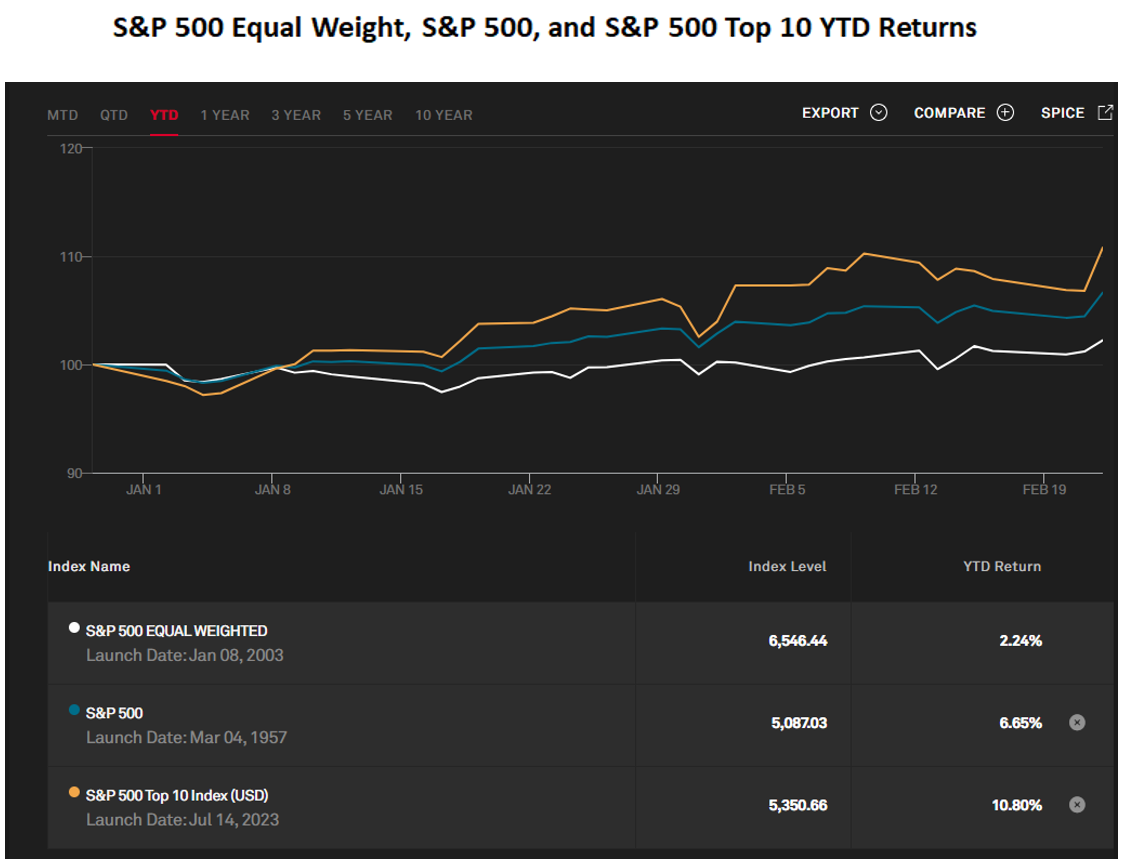
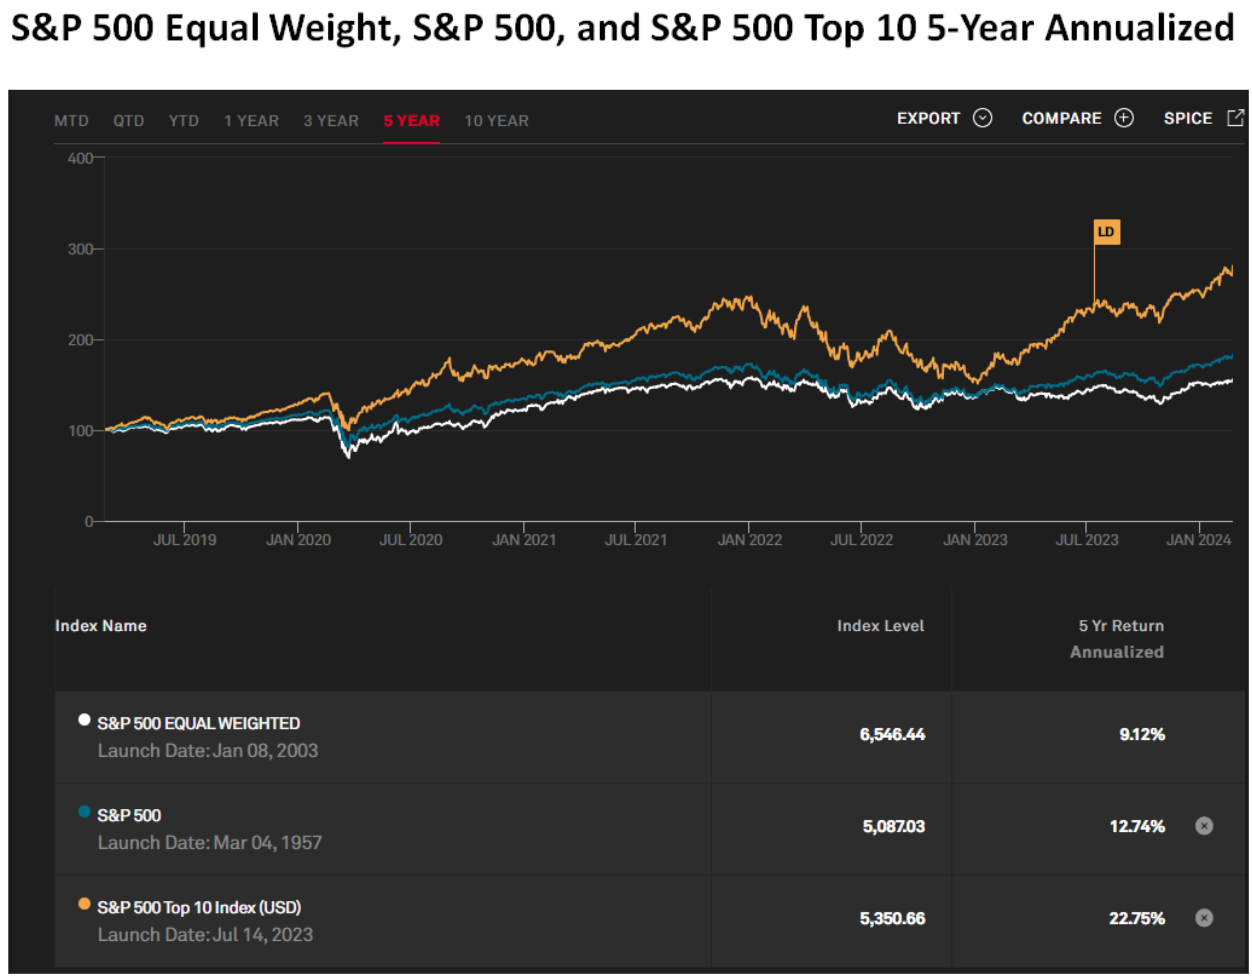
The surge in these largest tech companies like Nvidia has had a significant impact of late on various U.S. equity indices. The next charts compare three indices: the S&P 500 Equal Weight Index (white line), the S&P 500 Index (blue line), and the S&P 500 Top 10 Index (orange line). The S&P 500 Equal Weight Index measures returns by assigning an equal weight to all stocks in the index regardless of market cap, the S&P 500 Index measures the weighted-returns of the stocks in the index by market cap, and finally the S&P 500 Top 10 Index which measures weighted-returns of the top ten stocks in the S&P 500 by market cap and currently includes six of the Mag 7 stocks (Tesla currently sits 11th). As of yesterday’s close, the year-to-date returns for the equal weight, overall, and top 10 indices came in at 2.24%, 6.65%, and 10.80%, respectively. Moving to the 5-year annualized returns below, the equal weight, overall, and top 10 index returns have been 9.12%, 12.74%, and 22.75, respectively.

Source: S&P Global

Source: S&P Global; NOTE: LD references LAUNCH DATE
This demonstrates the difficulty of using variations of the same source index as benchmarks against the active management of a U.S. equity portfolio when just a few stocks can significantly affect the returns of a much broader index. It also confirms the need for diversification. Although we have pointed out the positive influence these recent returns have had recently, similarly, a correction by these concentrated companies can have just as significant downside effect (such as in 2022).
Sources: CNBC.com, Globe and Mail, Financial Post, Bloomberg, Thomson Reuters, Richardson Wealth, Bloomberg, S&P Global
©2024 Milestone Wealth Management Ltd. All rights reserved.
DISCLAIMER: Investing in equities is not guaranteed, values change frequently, and past performance is not necessarily an indicator of future performance. Investors cannot invest directly in an index. Index returns do not reflect any fees, expenses, or sales charges. Opinions and estimates are written as of the date of this report and may change without notice. Any commentaries, reports or other content are provided for your information only and are not considered investment advice. Readers should not act on this information without first consulting Milestone, their investment advisor, tax advisor, financial planner or lawyer. This communication is intended for Canadian residents only and does not constitute as an offer or solicitation by anyone in any jurisdiction in which such an offer is not allowed.