Market Insights: Potential Fed Pivot
Milestone Wealth Management Ltd. - Feb 02, 2024
Macroeconomic and Market Developments:
- North American markets were mixed this week. In Canada, the S&P/TSX Composite Index dropped 0.19%. In the U.S., the Dow Jones Industrial Average increased 1.43% and the S&P 500 Index rose 1.38%.
- The Canadian dollar lost slightly this week, closing at 74.30 cents vs 74.36 cents last Friday.
- Oil prices waned this week. U.S. West Texas crude closed at US$72.16 vs US$77.95 last Friday.
- The price of gold rallied this week, closing at US$2,037 vs US$2,018 last Friday.
- Canada's budget deficit widened and reached $4.01 billion in November, compared to a shortfall of $3.38 billion the same time last year. For the first eight months of its 2023 - 24 fiscal year, the federal government posted a deficit of $19.1 billion, compared to nearly $3.6 billion reported for the same period in the previous fiscal year.
- The Canadian economy may have staved off a recession in 2023. Preliminary data suggests that Canada's GDP grew by 0.3% in December, led by manufacturing, real estate, and the oil and gas sectors. The data suggests that the economy may prove to have grown in Q4, which would negate the recession call.
- The U.S. Federal Reserve concluded its January meeting on Wednesday, choosing to hold rates steady for the fourth consecutive meeting. Also, Fed Chairman Jerome Powell said Wednesday that the central bank would likely not be comfortable enough with the path of inflation by its next meeting in March to cut interest rates.
- U.S. employment numbers for January surprised to the upside with nonfarm payrolls increasing a whopping 353,000 in January, beating expectations of 185,000. Payroll gains for November and December were revised up by a total of 126,000, bringing the net gain, including revisions, to 479,000. The unemployment rate remains at 3.7%.
- Big tech stole this show this week with blowout earnings across the board:
- Apple (AAPL) released results that beat estimates for revenue and earnings, but it showed a 13% decline in sales in China, one of its most important markets. Earnings were $2.18/share vs $2.10/share expected on revenue of $119.58 billion vs $117.91 billion expected. The all-important iPhone revenue was $69.70 billion vs $67.82 billion expected.
- Alphabet (GOOG) beat expectations on earnings and revenue. Earnings came in at $1.64/share vs $1.59/share expected on revenue of $86.31 billion vs $85.33 billion expected. However, the crucial metric of ad revenue disappointed investors, sending the stock down on the news.
- Microsoft (MSFT) also beat expectations on earnings and revenue. Earnings were $2.93/share vs $2.78/share expected on revenue of $62.02 billion vs $61.12 billion expected.
- Amazon (AMZN) beat expectations with earnings coming in at $1.00/share vs $0.80/share expected on revenue of $170.0 billion vs $166.2 billion expected.
- Meta Platforms (META), owner of Facebook, WhatsApp and Instagram, posted positive results and declared its first dividend and a stock buyback program. Earnings came in at $5.33/share vs $4.96/share expected on revenue of $40.1 billion vs $39.18 billion expected. Today marked the biggest single-day market cap additions at $205.3B for META. The stock closed up 20.51% for the week and up 37.17% YTD.
- Imperial Oil (IMO) reported better than expected Q4 earnings of $2.47/share vs $2.12/share expected, with revenue of $13.11 billion vs $13.09 billion and a production beat of 447 Mboe/d vs 442.5 Mboe/d forecast. The company also announced that it has increased its quarterly dividend by 20.0% to $0.60/share from $0.50/share.
Weekly Diversion:
Check out this video of the new largest cruise ship in the world.
Charts of the Week:
Recent inflation numbers have been improving in North America making market participants wonder when short-term interest rates will begin to fall. Both the U.S. Federal Reserve (Fed) and the Bank of Canada met in January electing to leave their overnight rates unchanged. The first two charts highlight the target interest rates for both central banks over the past year. The Fed’s next policy decision meeting is on March 20th, while the Bank of Canada makes their next rate decision on March 8th. The next few meetings will certainly be closely watched for not just the first rate cut, but also the central banks’ language for future rate cuts.
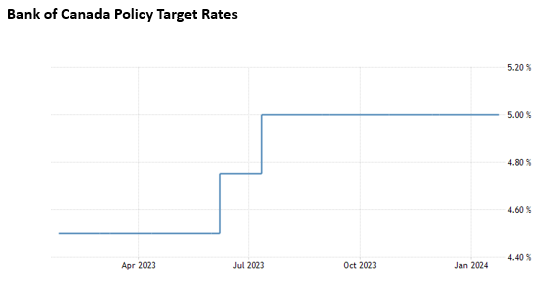
Source: Trading Economics via Bank of Canada
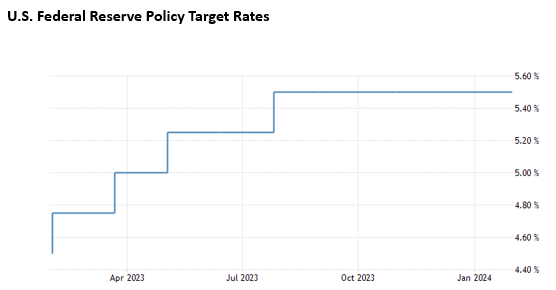
Source: Trading Economics via US Federal Reserve
Let’s look at some useful tools that are used to estimate the probability of upcoming central bank key target rate movements. Without getting into too much detail on how these probabilities are derived, the first table below shows the percentage chance of where movements will be for Canadian target rates over the next couple years. These probabilities are derived by using implied short term interest rates through the futures markets. As we can see today, there is a 94% chance that we will see a 0.25% cut in target interest rates by June and a 98% chance of a 1.00% cut in target interest rates by the end of this year.
The second chart focuses on U.S. target rate projections using the 30-day Fed funds futures pricing data. These are derivatives based on the federal funds rate, the U.S. overnight interbank lending rate on reserves deposited with the Fed, and they trade on the Chicago Mercantile Exchange (CME). This CME FedWatch Tool available online is monitored by market participants and helps visualize probabilities of future Federal Open Market Committee (FOMC) rate change outcomes. As of right now, there is a 92.6% chance of a 1.00% or more cut in target interest rates by the FOMC’s December 18th meeting. The U.S. market is essentially predicting a greater than 50% chance of at least five 0.25% rate cuts by the end of this year.
It is important to note that these are current projections based on probabilities implied by the futures market, and as we progress through the year this will change.
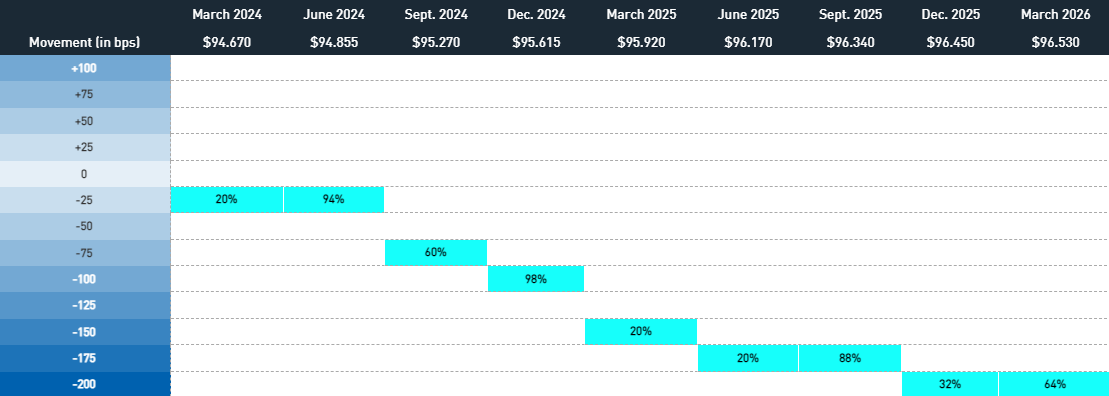
Source: TMX Group
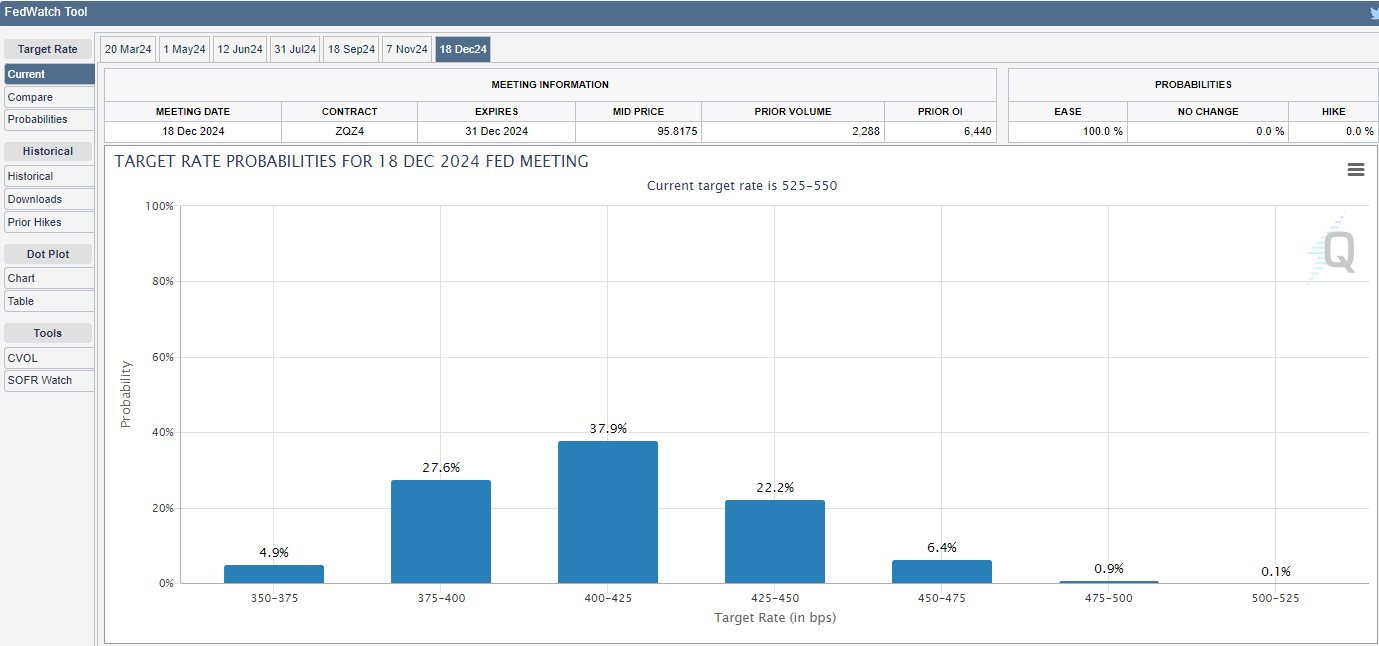
Source: CME Group
On a final word, we will present a chart about Fed pivots that we found interesting. Apart from a few severe recessionary periods, a condition which at present is not in play, the last chart below shows that U.S. stock markets have historically performed very well, on average, when the Fed has pivoted from rate hikes to rate cuts. Fed policy has been a significant contributor to market movements, especially in recent times, so it is no surprise that there is a term in our industry that says, “Don’t fight the Fed”. Time will tell if this projected pivot to rate cuts will have the same effect on markets.
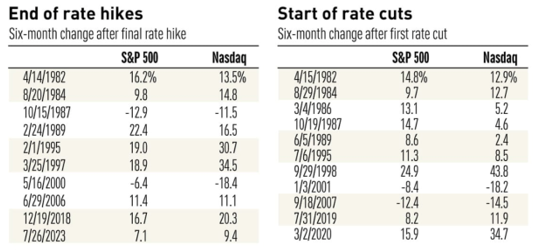
Source: Investor’s Business Daily via Investors.com
Sources: CNBC.com, Globe and Mail, Financial Post, Bloomberg, Thomson Reuters, Richardson Wealth, Refinitiv, Trading Economics, Investor’s Business Daily, Investors.com, CME Group, TMX Group, US Federal Reserve, Bank of Canada
©2024 Milestone Wealth Management Ltd. All rights reserved.
DISCLAIMER: Investing in equities is not guaranteed, values change frequently, and past performance is not necessarily an indicator of future performance. Investors cannot invest directly in an index. Index returns do not reflect any fees, expenses, or sales charges. Opinions and estimates are written as of the date of this report and may change without notice. Any commentaries, reports or other content are provided for your information only and are not considered investment advice. Readers should not act on this information without first consulting Milestone, their investment advisor, tax advisor, financial planner or lawyer. This communication is intended for Canadian residents only and does not constitute as an offer or solicitation by anyone in any jurisdiction in which such an offer is not allowed.