Market Insights: Returns Mostly Driven by Earnings vs. Growth
Milestone Wealth Management Ltd. - Jan 19, 2024
Macroeconomic and Market Developments:
- North American markets were mixed this week. In Canada, the S&P/TSX Composite Index decreased 0.40%. In the U.S., the Dow Jones Industrial Average increased 0.72% and the S&P 500 Index rose 1.17%.
- The Canadian dollar declined this week, closing at 74.46 cents vs. 74.81 cents USD last Friday.
- Oil prices were down slightly this week. U.S. West Texas crude closed at US$73.79 vs. US$73.93 last Friday.
- The price of gold waned this week, closing at US$2,029 vs. US$2,044 last Friday.
- The Canadian Consumer Price Index (CPI) rose 3.4% in December from a year ago, following a 3.1% increase a month earlier. On a monthly basis, the index fell 0.3%, the biggest drop since December 2022, and is largely due to declines in prices for travel tours and gasoline.
- The U.S. Consumer Price Index increased 0.3% vs 0.2% expected in December and 3.4% from a year ago vs. 3.2% expected. Excluding volatile food and energy prices, the Core CPI also rose 0.3% for the month and 3.9% from a year ago compared to 4.0% last month. Much of the headline increase came due to rising shelter costs, accounting for more than half the Core CPI increase.
- Last Wednesday, the U.S. Securities and Exchange Commission (SEC) approved ETFs to trade on Bitcoin for the first time. A total of 11 applications were approved and those ETFs started trading as early as the following morning. The news lifted the price of Bitcoin but Ether, the second biggest cryptocurrency, got an even bigger lift on hopes that ETFs would be approved on it as well soon.
- Shell PLC has entered into a 20-year deal to purchase liquefied natural gas (LNG) from the proposed Ksi Lisims project in BC. The agreement is the first binding deal for the project and involves the supply of 2 million metric tons of LNG per year to energy markets in Asia.
- Hewlett Packard Enterprise (HPE) and Juniper Networks (JNPR) announced that the companies have entered into an agreement under which Hewlett Packard will acquire Juniper in an all-cash transaction for $40.00 per share, representing an equity value of approximately $14 billion.
- U.S. banks kicked off earnings season last Friday:
- JPMorgan Chase (JPM) beat estimates with $3.04/share in quarterly earnings on revenue of $39.94 billion vs $39.78 billion expected by analysts.
- Wells Fargo (WFC) also beat expectations with $1.29/share in earnings, with revenue of $20.48 billion vs the $20.30 billion forecast.
- Citigroup (C) reported quarterly earnings of $0.84/share on revenue of $17.44 billion vs $18.74 billion expected.
- Bank of America (BAC) reported quarterly earnings of $0.70/share on revenue of $22.1 billion vs $23.74 billion expected.
- Tim Horton’s owner Restaurant Brands International (QSR) and Carrols Restaurant Group (TAST) announced that they have reached an agreement for QSR to acquire all of the Carrols outstanding shares not already owned for $9.55/share in an all-cash deal. The transaction gives a total enterprise value of ~$1.0 billion for TAST.
Weekly Diversion:
This week’s diversion is a personal one. Shawn’s daughter Maryn has set up a TikTok channel for their new puppy and her cute videos have gone viral with over 3.3 MILLION VIEWS and thousands of followers. Click here to meet Lily
Chart of the Week:
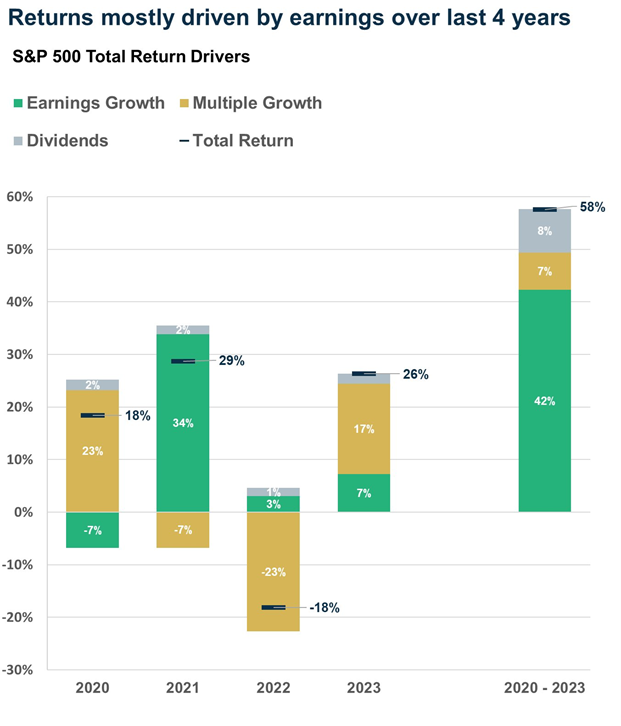
There has been a lot of talk about how stock P/E (Price/Earnings) multiple expansion has been the main driver of returns in the market; however, when we explore this week’s chart of the week, we can see that returns over the past four years have primarily been driven by earnings growth. There are three main factors when considering investment returns; these include earnings growth, multiple growth, and dividends. Earnings growth refers to the annual compound annual growth rate (CAGR) of corporate earnings. It is a key indicator of the health and profitability of a business after all expenses are paid. This is used in valuation models and is a key factor in determining a stock's intrinsic value. It is calculated by comparing the change in an entity's reported net income over a period, such as quarterly or yearly. A high level of earnings growth is generally considered favorable, indicating a healthy and profitable business. In contrast, multiple growth refers to the impact of a company's growth on its valuation multiple. Valuation multiples are used to compare companies and determine their relative value. They measure aspects of a company's financial well-being by comparing two metrics, price and earnings, by dividing one by the other to derive their P/E multiple. When a company's growth rate increases, it can lead to higher P/E valuation multiples, indicating that investors are willing to pay more for the company's future earnings. Lastly, dividends are payments made by a company to its shareholders as a distribution of profits. Companies that consistently grow their dividends over time also generally contribute to higher company valuations.
This week’s chart of the week focuses on the above-described drivers and their impact on the total returns for the S&P 500 Index over the past four years. As the chart illustrates, the returns for the past four years ranged from 18% in 2020, 29% in 2021, -18% in 2022, 26% in 2023 and a total four-year cumulative return of 58%. Dividends remained consistent, representing 8% of the total four-year return. However, it is interesting to note that multiple growth only contributed 7% of the total four-year return compared to earnings growth contributing 42% of the total four-year return. Growth stocks have dominated market news, most recently with the “Magnificent 7” (Apple, Microsoft, Alphabet, Amazon, Nvidia, Meta, and Tesla) posting amazing returns in 2023, but when we observe longer trends, we can see that strong earnings have been the more significant contributor to total returns.
Source: Carson Investment Research
Sources: CNBC.com, Globe and Mail, Financial Post, Bloomberg, Thomson Reuters, Richardson Wealth, Refinitiv, Carson Investment Research
©2024 Milestone Wealth Management Ltd. All rights reserved.
DISCLAIMER: Investing in equities is not guaranteed, values change frequently, and past performance is not necessarily an indicator of future performance. Investors cannot invest directly in an index. Index returns do not reflect any fees, expenses, or sales charges. Opinions and estimates are written as of the date of this report and may change without notice. Any commentaries, reports or other content are provided for your information only and are not considered investment advice. Readers should not act on this information without first consulting Milestone, their investment advisor, tax advisor, financial planner or lawyer. This communication is intended for Canadian residents only and does not constitute as an offer or solicitation by anyone in any jurisdiction in which such an offer is not allowed.