Market Insights: Fourth Quarter Wrap-up
Milestone Wealth Management Ltd. - Jan 12, 2024
*For PDF Version, please click here*

Key Updates on the Economy & Markets
Financial markets underwent a sizeable shift in the fourth quarter. U.S. Treasury yields, which spiked in Q3, reversed lower as inflation eased and the U.S. Federal Reserve hinted at interest rate cuts in 2024. The decline in interest rates was a significant tailwind for stocks and bonds. Equity markets enjoyed their strongest quarter in three years, and bonds produced their best quarterly return since Q2 1989. This letter recaps the fourth quarter, discusses the decline in Treasury yields and the potential for interest rate cuts, and looks ahead to 2024.
Treasury Yields Reverse Lower in Fourth Quarter
Following a significant increase in Q3, Treasury yields moved sharply lower in Q4. Figure 1, which compares the change in yields during the two quarters, graphs the opposing interest rate moves. The gray bars show yields increased in Q3, with longer maturity yields rising the most. In contrast, the navy bars show yields reversed sharply in Q4, erasing nearly all their Q3 rise. The abrupt reversal can be attributed to a significant change in the market’s view heading into 2024.
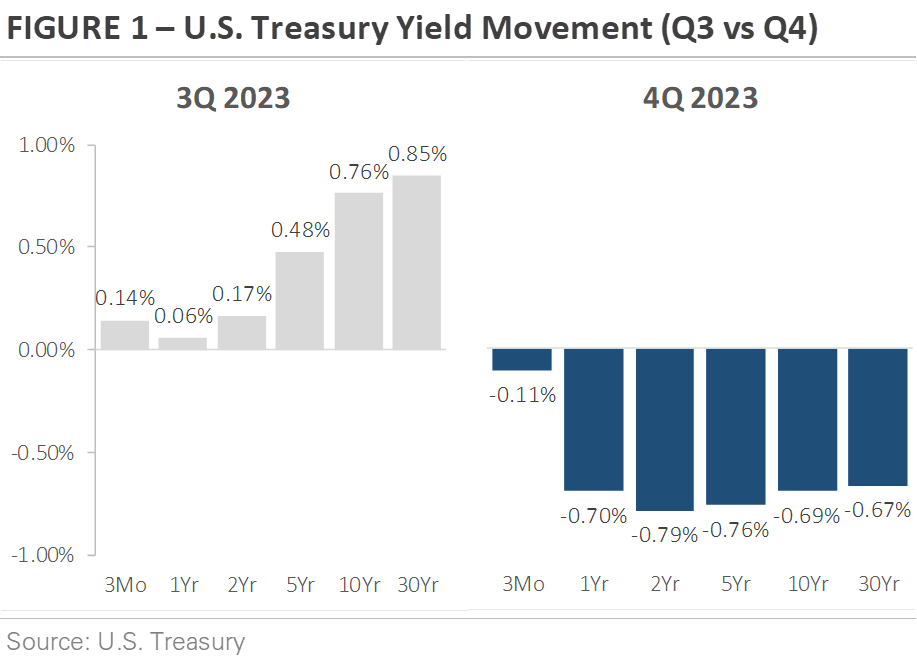
Investors had two key concerns, both of which contributed to the rise in Treasury yields during Q3. First, the U.S. economy continued to outperform expectations, which raised concerns that the Federal Reserve might need to keep interest rates high for an extended period to cool inflation. Second, the fiscal deficit was growing quickly as government spending increased. Investors were concerned the U.S. Treasury would need to issue a large amount of new debt to finance the growing deficit but that there wouldn’t be enough buyers for the new bonds, potentially causing yields to rise if supply outweighed demand.
A notable shift occurred in November, setting off a sharp reversal in Treasury yields. Investor worries about increased Treasury bond issuance were alleviated as the U.S. Treasury revealed plans to slowly increase bond issuance. The market felt there would be enough demand to absorb the new bonds, lowering the probability that too much bond supply would cause yields to rise. In addition, data showed that inflation continued to decline even as the economy continued to exceed expectations. Investors’ fears about persistent inflation and high interest rates faded from view, yields declined, and equities soared.
With Inflation Falling, Market Expects Rate Cuts
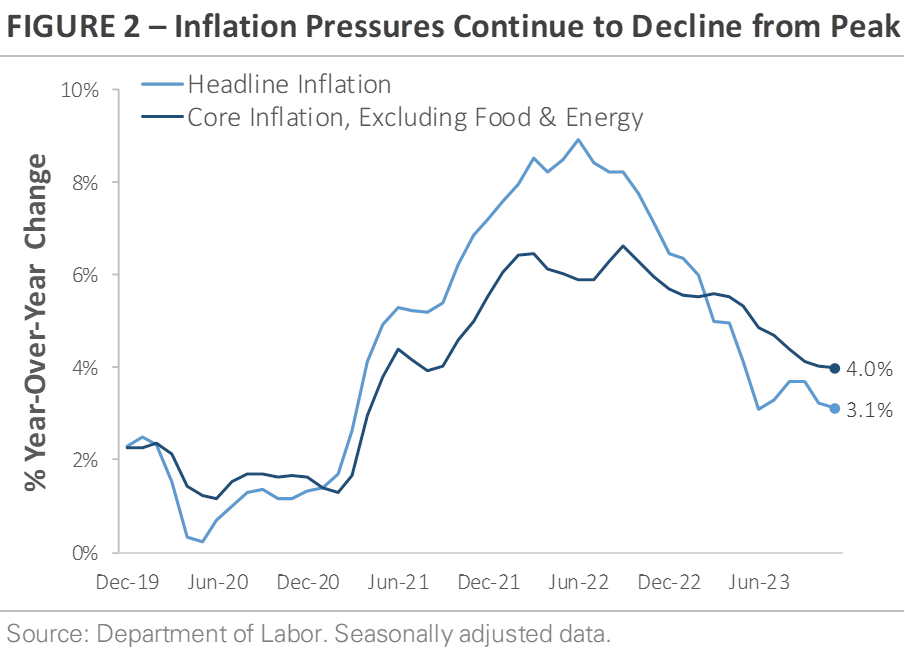
Data shows that inflation pressures continue to ease. Figure 2 graphs the year-over-year change in U.S. headline and core inflation. Headline inflation, which peaked at 9.1% in June 2022, dropped to 3.1% in November 2023 (same 3.1% for Canada). Likewise, core inflation, which excludes the volatile categories of food and energy, now stands at 4.0% as of November (2.8% in Canada) after peaking at 6.6% in September 2022. The price declines have been widespread across categories, with price pressures easing across food, energy, airfares, and household furnishings and appliances.
Investor optimism is on the rise as price pressures ease, with inflation forecasted to remain low and stable in 2024. Likewise, the Federal Reserve is hinting at interest rate cuts if inflation continues to fall. Investors are more confident that the Fed will cut interest rates in early 2024, with no clear need to keep interest rates at current levels as inflation falls back toward 2%. Looking ahead to 2024, futures markets currently forecast six 25bps interest rate cuts, with the first cut as early as March. It’s a big change from Q3, when there was concern that the Federal Reserve would need to keep raising interest rates. One of the key themes to watch in 2024 will be how much the Federal Reserve cuts rates.
U.S. Economy Defied Expectations in 2023
The question heading into 2023 was whether the economy could withstand the effects of higher interest rates. The Federal Reserve aimed to cool inflation by raising interest rates and reducing demand, and the central bank appeared to be well on its way toward accomplishing its goal. The cost of capital was rapidly increasing. The housing market and home construction activity were slowing. Shipping rates were falling as freight demand declined and supply chains normalized. While portions of the economy slowed in 2023, the broader economy displayed remarkable resilience, even as the Federal Reserve continued to raise interest rates.
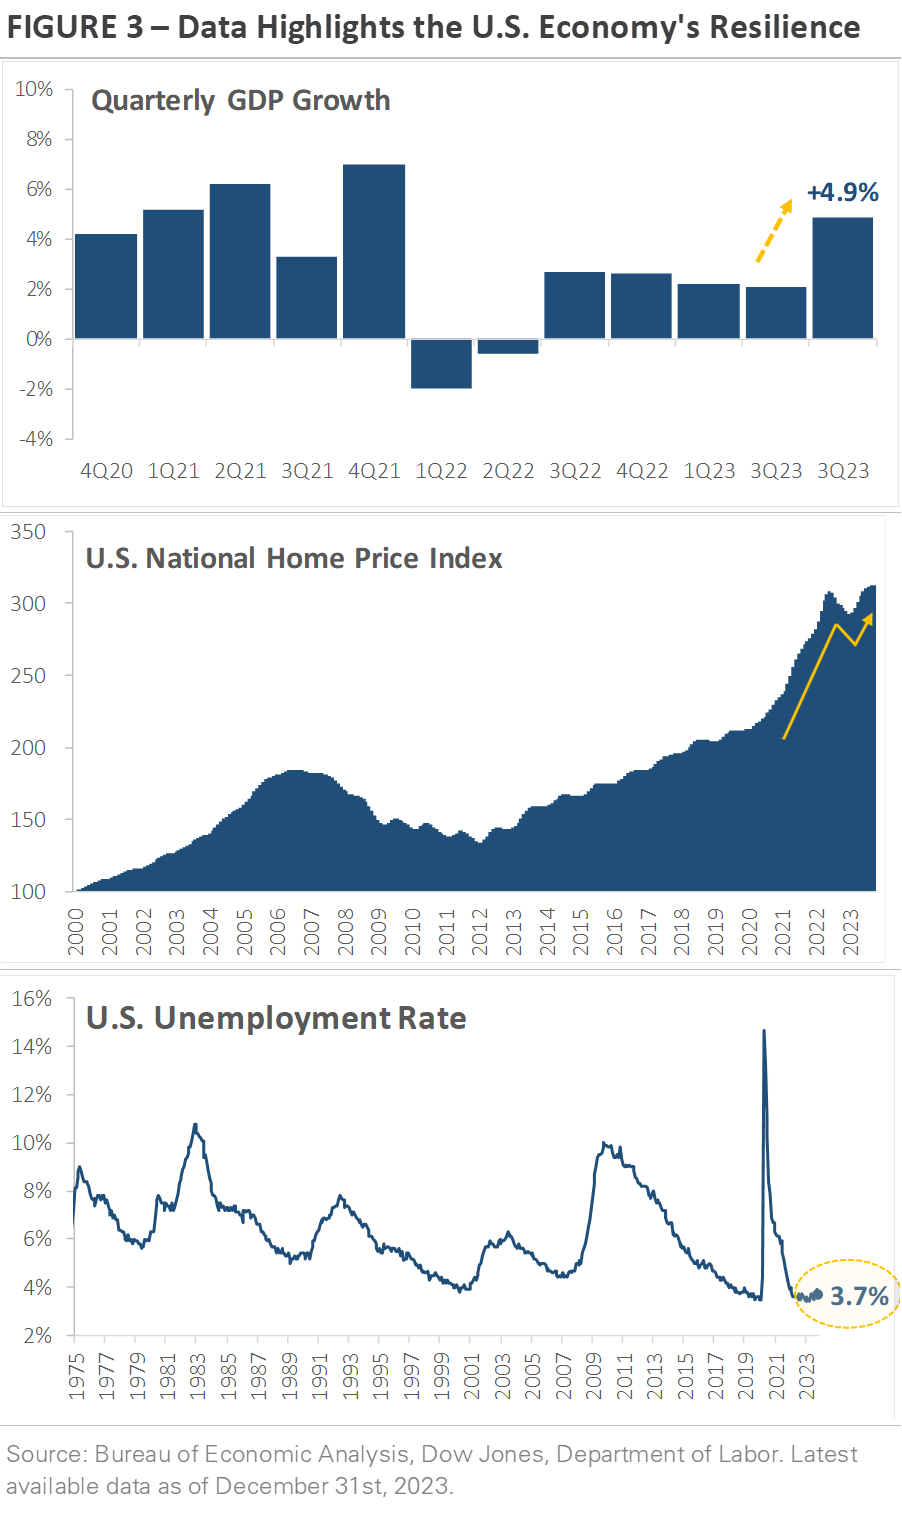
Figure 3 graphs three data points that underscore this resilience. The top chart shows the U.S. economy grew at a +4.9% annualized pace in Q3, the fastest pace since Q4 2021. This compares to a dismal -1.1% annualized growth rate decline for Canada. Multiple factors contributed to the above-average growth, including consumer spending, government investment at the federal and state levels, and companies restocking inventories. The middle section shows the surge in U.S. home prices during the pandemic, as factors like remote work, low mortgage rates, and rising wages boosted home demand. The home price index initially peaked in mid-2022 and declined over the next 10 months as rising mortgage rates weighed on demand. However, home prices rose to a new record high as the housing market reaccelerated in the second half of 2023. The bottom chart shows the U.S. unemployment rate remains below 4% (Canada at 5.8%), a level that is low by historical standards and showcases the labor market’s strength.
While these three data points are lagging and reflect past performance, they underscore the economy's resilience. They also indicate that higher interest rates aren’t having the impact that many thought they would. With inflation falling and the economy growing, investors are starting to believe that the Fed can achieve its goal of lowering inflation without negatively impacting the economy.
Equity Market Recap – Stocks Trade Near Highs
Falling interest rates were a tailwind for stocks in the fourth quarter. Key stock market indices like the S&P 500, the Dow Jones Industrials, the NASDAQ 100, and the Russell 2000 each returned more than +11% while in Canada the S&P/TSX Composite gained +11.8%. Real estate was the top-performing sector as falling interest rates relieved pressure on property owners, and cyclical sectors outperformed defensive sectors. In December, the Russell 2000 Index of U.S. small cap stocks outperformed the S&P 500 by +7.6%, its biggest month of outperformance since February 2000. The broad-based stock market rally demonstrates investors’ growing enthusiasm, with inflation falling, the economy surpassing expectations, and the Fed signaling the end of rate hikes.
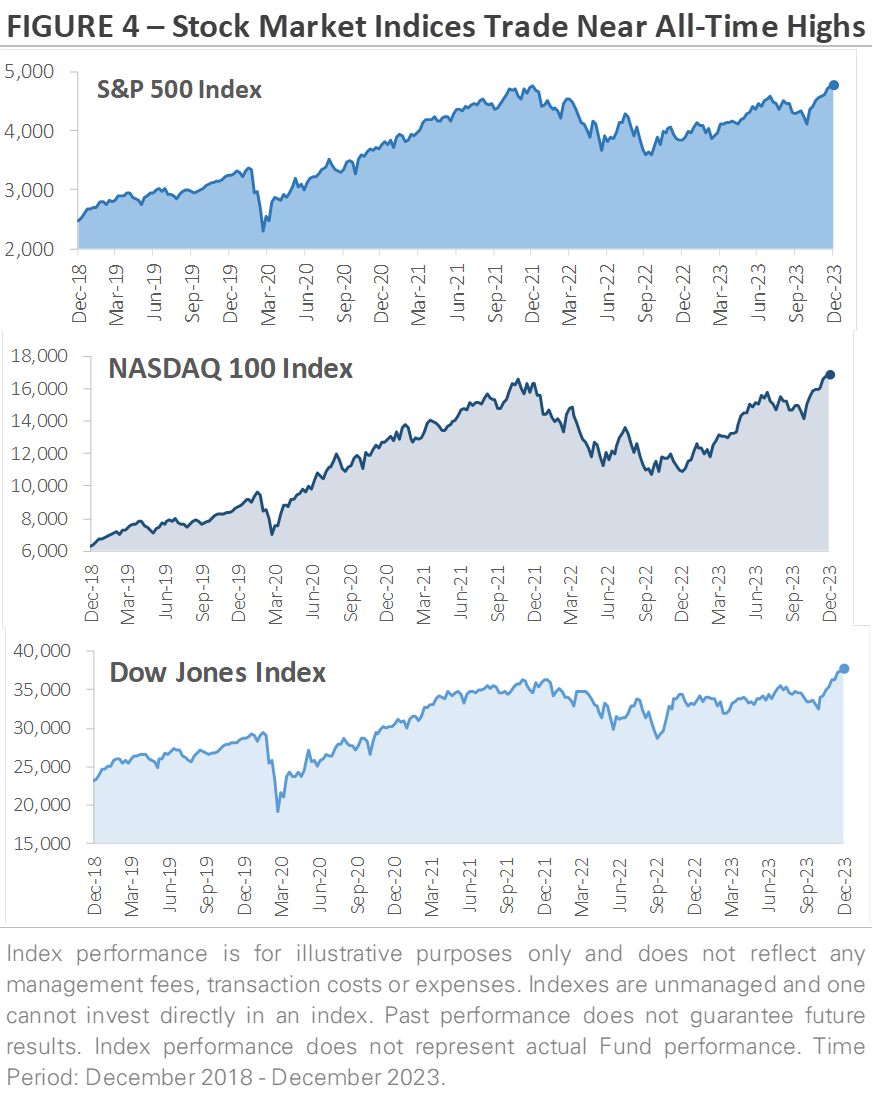
What does the financial landscape look like today? Following the Q4 rally, multiple major stock market indices are trading near all-time highs. Figure 4 on the next page graphs the prices of three broad stock market indices: the S&P 500, the NASDAQ 100, and the Dow Jones. The S&P 500 is hovering near its January 2022 all-time high (0.5% below), while the NASDAQ 100 and Dow Jones both made new all-time highs in December. On a year-to-date basis, the S&P 500 returned +26.3% including dividends in 2023, while the NYSE Composite returned +13.8%. The NASDAQ 100 soared +54.7%, its biggest year since 1999. In CAD terms, these returns are about 3% lower. Along the way, stocks defied higher interest rates, geopolitical tensions, and multiple U.S. regional bank failures to record solid gains.
In Q4, international stocks underperformed U.S. stocks for the third consecutive quarter. This underperformance can be attributed to multiple themes. First, international stock market indices, including here in Canada, lack exposure to leading artificial intelligence companies, like Microsoft and Nvidia. Second, as discussed above, the U.S. economy has displayed resilience to higher interest rates. In contrast, some countries and regions outside the U.S. are already showing the effect of higher interest rates, such as here in Canada with our housing situation. Investors are attracted to the U.S. for both its AI exposure and relative economic strength.
A Tale of Two Markets
We have written about this in our weekly commentaries during 2023, but we would be remiss not to highlight what we would call the story of the year for equities (perhaps two years), a tale of two equity markets, the ‘Magnificent 7’ (M7) and the rest of the market. This term was coined by Bank of America’s strategist Michael Hartnett to describe the most dominant U.S. tech companies. These also happen to be the largest market capitalization stocks in the S&P 500 Index: Microsoft, Apple, Alphabet, Amazon, Nvidia, Meta and Tesla (note: Tesla recently moved down 8th largest). Therefore, we have the M7 and then the rest of the large-cap market, we will call this the ‘S&P 493’.
One theme that became apparent in 2023 was that U.S. mega-cap tech became the ‘go-to’ defensive stocks for investors as opposed to the traditional defensive areas like Consumer Staples, Utilities and Health Care which were among the worst performers. The strength of the M7 was the ultimate driving force behind the strong 2023 return for the S&P 500 Index (and the opposite for 2022). As a result, the average stock and most active investors likely didn’t perform as well.
If you can believe it, as recently as the end of October, the S&P 493 (as were the S&P 500 Equal Weight Index and Russell 2000) was negative year-to-date. Then, with softer inflation numbers and a more dovish Fed commentary, long-term yields dropped a whopping 1% in a matter of weeks, and the stock market joined the party to enjoy their longest winning streak (nine weeks in a row) since January 2004.
For the year, the S&P 500’s 26.3% total return helped offset 2022’s loss of 18.1%, leaving a two-year price gain of just 0.08% (3.42% total return). As for the M7, they truly were ‘magnificent’ last year with an average total gain of 104.7% each, accounting for 62.2% of the S&P 500’s total return, leaving the S&P 493 with a total return of ‘just’ 9.94%. This made up for 2022, when the M7 all declined an average of 45.31%. For the total two-year period of 2022-2023, the M7 attributed 2.05% of the 3.42% total return for the S&P 500, while the S&P 493 returned just 1.37% and still slightly in the red not including dividends. This tale of two markets describes the incredible movement of U.S. equity markets, both on the downside in 2022, and the upside in 2023.
While Canada’s sectors mostly mirrored those of the U.S. last year, our energy sector managed a 4.1 % total return while the U.S. energy sector fell 1.3%. Our utilities fared better - and our real estate fared worse - than our big brother to the south. Although the tech sector in Canada is just a fraction of the size in the U.S. and makes up a much smaller proportion of our market on a relative basis, it has grown to be the fifth largest sector now. While the S&P/TSX Composite climbed 8.1% last year (11.8% total return), if you remove the technology sector, the Composite only returned closer to 8%.
Credit Market Recap – Bonds Rally as Yields Fall
Bonds traded higher in Q4 as Treasury yields reversed their Q3 rise. The Bloomberg U.S. Bond Aggregate, which tracks a broad index of U.S. investment-grade rated bonds, produced a total return of +6.7%. It marked the first quarterly gain since Q1 2023, and the biggest quarterly gain since Q2 1989, bringing the 2023 return up to 5.5%. This shift in investor sentiment toward bonds can be attributed to several factors, including two themes we’ve already discussed. Inflation is falling, and the Federal Reserve is expected to start cutting interest rates. In Canada, our S&P Canada Aggregate Bond Index returned 6.3% for all of 2023, following a double-digit decline in 2022 and back-to-back calendar year declines.
After weathering an extended period of negative returns as the Federal Reserve raised interest rates, bonds are now experiencing a resurgence in popularity. Investors have been trying to time the top in Treasury yields, and as sentiment improved and rates declined in Q4, investors rushed to lock in yields. It’s a dynamic that’s played out in recent quarters, which has contributed to the increased bond market volatility. The question is whether investors have accurately picked the peak in yields. The answer will be determined by the trajectory of inflation and the Fed’s interest rate cuts.
2024 Outlook – What to Watch?
Heading into the new year, the economy is growing at a solid pace, the labor market is tight, inflation is decelerating, and the U.S. housing market shows early signs of a rebound. Economic data indicates that higher interest rates have yet to make a significant impact. Stocks trade near all-time highs, and bonds just staged their best quarter since 1989. There is a growing sense of optimism, but can the economy live up to that optimism?
Multiple themes suggest the U.S. economy experienced a structural shift during the pandemic. Cross country migration during the pandemic is driving increased government investment today as states and local municipalities expand and build infrastructure to meet increased demand and usage. This translates into new schools, more expansive road networks, new neighborhoods, and airport expansions. In addition, there is still a housing shortage after the U.S. underbuilt following the 2008 financial crisis. Remote work is a new phenomenon, but it doesn't appear to be going away anytime soon. Fridays and Mondays are no longer constraints on taking a weekend trip, which could lead to more spending on services and experiences. It takes time for higher interest rates to work their way into the economy, and the economy could slow in 2024. However, these structural changes demonstrate how today’s economy differs from the pre-pandemic economy.
We would argue that the biggest macro surprise last year was the absence of economic weakness in the U.S. and no recession, going against almost every major economist’s forecast coming into 2023. While there are some leading indicators like New Orders from the ISM Manufacturing Index that still point to a possible recession in 2024, the positive progression of GDP estimates for 2023 and 2024 suggests forecasters have become increasingly optimistic towards future growth. We were not in that same recession camp at the beginning of 2023 as our readers know, but more cautiously optimistic that we could have a strong 2023 after the worst year (2022) since 2008. It turned out to be much stronger than anticipated.
This year, we are of the thought process that while slower than 2023, U.S. consumer spending, which drives corporate revenue & profit growth, will remain supporting of economic growth in 2024, thanks to what seems to be a bottomless pit of excess U.S. household savings and a decelerating but still decent jobs market. Clearly, the inflation outlook from here remains key for the direction of risk assets; however, at least in the near-term, there appears to be little risk that goods pricing will rebound so the pricing outlook for the U.S. service sector will likely play the main role. Although service-based inflation has remained higher, the most recent releases of CPI and PCE (Fed’s favored inflation measures) do seem to be supportive of them falling into the mid-2% range over the next few months. It is possible that equity markets have simply moved up quickly in advance of that economic reality, so risk management will likely be key in the first half of 2024. Also, the M7 may not play as big of a role to the upside as they did in 2023, so a diversified approach to stocks and sectors, as well as appropriate allocations to alternative asset classes should be important.
Looking ahead at the calendar, the 2024 presidential election will grab headlines for most of the year, with the first primary elections taking place in January. It will be a busy time as candidates discuss their platforms. There will be a lot of talk about new policies and big changes, but it’s important to keep the bigger picture in mind. Election headlines tend to be more noise than anything of substance. Elections create uncertainty and volatility, but history shows us that economic growth and corporate earnings ultimately drive markets over the long term. Our focus in 2024 will be on the growing list of non-political themes, such as interest rate cuts and the post-pandemic changes impacting the economy.
Thank you for your continued Trust in Milestone and for the opportunity to assist you in working toward your financial goals. We understand the risks facing both the markets and the economy, and we are committed to helping you effectively navigate this challenging investment environment. Successful investing is a marathon, not a sprint, and even intense volatility is unlikely to alter a diversified approach set up to meet your long-term investment goals. Therefore, it’s critical to stay invested, remain patient, and stick to the plan, as we’ve worked with you to establish a unique, personal allocation target based on your financial position, risk tolerance, and investment timeline.
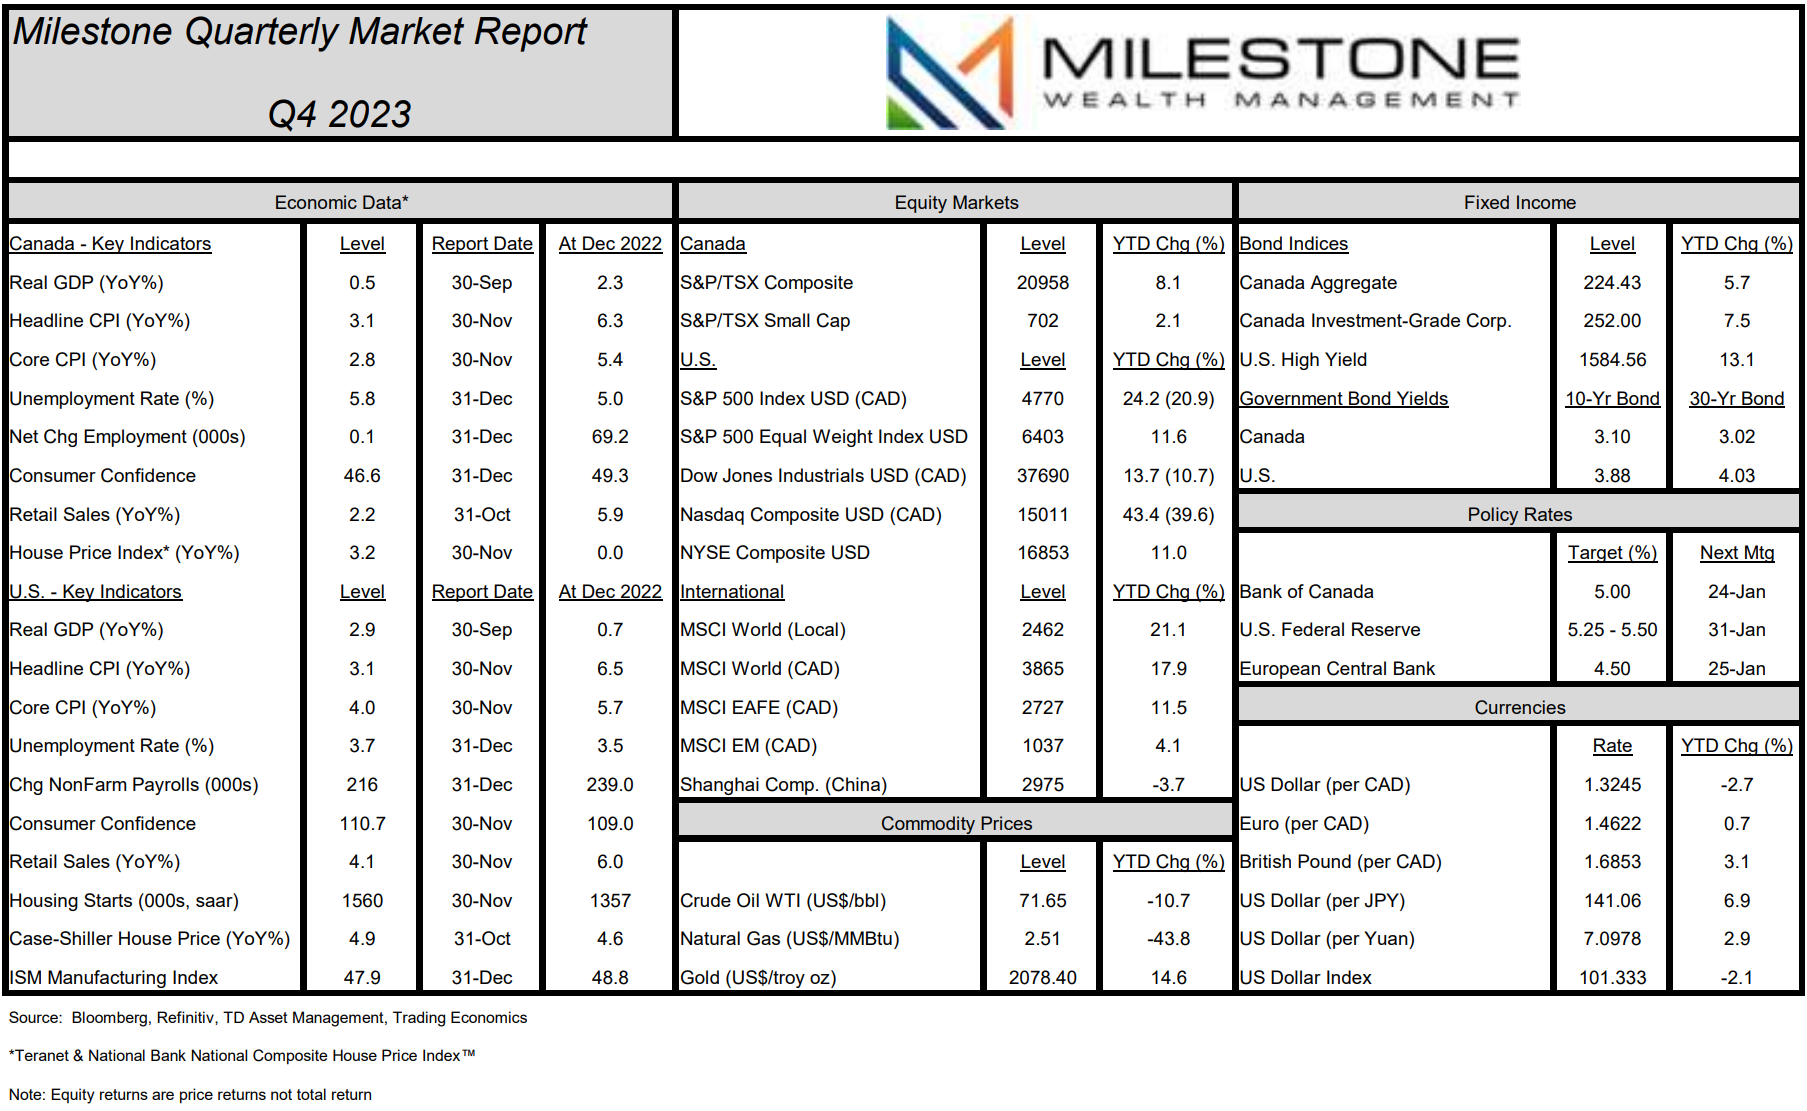
Here is our Quarterly Market Report on economic data, capital markets, commodities, and currencies through December 31st, 2023:
Disclosure:
Investing in equities is not guaranteed, values change frequently, and past performance is not necessarily an indicator of future performance. Investors cannot invest directly in an index. Index returns do not reflect any fees, expenses, or sales charges. Opinions and estimates are written as of the date of this report and may change without notice. Any commentaries, reports or other content are provided for your information only and are not considered investment advice. Readers should not act on this information without first consulting Milestone, their investment advisor, tax advisor, financial planner, or lawyer. This communication is intended for Canadian residents only and does not constitute as an offer or solicitation by anyone in any jurisdiction in which such an offer is not allowed.
Sources: Thomson Reuters, BNN Bloomberg, Refinitiv, TD Asset Management, Teranet and National Bank of Canada, Forge First Asset Management, MarketDesk Research LLC, U.S. Treasury, U.S Department of Labor, U.S. Bureau of Economic Analysis, Dow Jones.
©2024 Milestone Wealth Management Ltd. All rights reserved.