Market Insights: Investment Needed for Pivot to Renewable Energy
Milestone Wealth Management Ltd. - Jan 05, 2024
Macroeconomic and Market Developments:
- North American markets were down this week. In Canada, the S&P/TSX Composite Index decreased 0.10%. In the U.S., the Dow Jones Industrial Average declined 0.59% and the S&P 500 Index dropped 1.52%.
- The Canadian dollar pulled back this week, closing at 74.81 cents vs 75.51 cents USD last Friday.
- Oil prices were positive this week. U.S. West Texas crude closed at US$73.93 vs US$71.65 last Friday.
- The price of gold waned this week, closing at US$2,044 vs US$2,063 last Friday.
- The year started off on a negative note, with both bond and stock markets dropping in the first week. Profit taking from the recent rally, in addition to reduced optimism about the timing of interest rate cuts seemed to take some of the wind out of the markets’ sails.
- The Canada Manufacturing PMI (Purchasing Managers Index) fell to a seasonally adjusted 45.4 in December. A reading below 50 indicates contraction, and the PMI has been below that level since May 2023, making it the longest such stretch in data going back to October 2010. Similarly, the Canadian Services PMI came in at 44.6, slightly up from November's 44.5 but still below the 50-point expansion/contraction threshold.
- Suncor Energy (SU) reported fourth-quarter oil output of 808,000 bpd, marking its second-highest quarter ever. The strong production figures, which surpassed the corporate forecast and resulted in an annual average upstream production of 746,000 bpd, have contributed to a rise in Suncor's share price. The fourth-quarter output includes 758,000 barrels per day of oilsands production and 50,000 bpd from exploration and production operations.
- The Canadian jobs market was essentially flat for the month of December, with the economy generating just 100 jobs compared with the forecast for a gain of 15,000 jobs. The unemployment rate stayed steady at 5.8%, reinforcing the view that the Canadian economy seems to have stalled.
- However, the U.S. jobs market continued to show growth. The economy added 216,000 jobs in December, higher than the 170,000 forecast. The unemployment rate stayed at 3.7%.
- Tesla (TSLA) delivered 484,507 vehicles in the fourth quarter, surpassing analysts' estimates of 483,173 deliveries. However, the company fell behind China's BYD Co. in global electric-car sales for the quarter. BYD sold 526,409 fully electric vehicles, making it the new leader in electric vehicle sales, primarily driven by its broader lineup of more affordable models in China.
Weekly Diversion:
Check out this video: GoPro: Best of 2023
Charts of the Week:
The 2030 Renewable Energy Targets, with the aim of keeping the global temperature increase limit of 1.5°C, has been a major focus point for many countries, and with COP28 wrapping up last month, many countries and industries have shown renewed interest in investing in renewable energy.
Collectively, the U.S., European Union, China, India, and the UK account for more than 60% of global electricity consumption, so we first wanted to look at where these countries or regions have progressed in 2022 (2023 numbers will likely be provided later this year). The table below highlights these countries’ (or regions’) 2030 renewables target and future goals, as well as the annual average wind and solar capacity additions needed to meet the 2030 goal, and current (2022) capacity in Gigawatts (GW). Overall, the U.S. and India were the furthest off from their targets in 2022, adding only 46% and 57% of what was needed, respectively. European countries, on the other hand, made progress but still need substantial annual additions to meet their targets by 2030. Surprisingly, China stands out as the only nation on track to meet its 2030 target. In 2022, it not only met but significantly exceeded its required capacity additions to remain on track, adding 168% of the required 101 GW. Not included in the table is Canada, which has an emission reduction target of 40% below 2005 levels by 2030 and net-zero emissions by 2050.
| Country / Region | 2030 Target | Annual Average Wind and Solar Capacity Additions | Actual Capacity Additions in 2022 | ||||
| Needed to Hit 2030 Target | |||||||
|
|
| Wind | Solar | Total | Wind | Solar | Total |
| India | 40% zero-carbon generation by 2030 (includes nuclear) | 16 GW | 19 GW | 35 GW | 2 GW | 18 GW | 20 GW |
| China | 28% renewables by 2030 | 57 GW | 44 GW | 101 GW | 55 GW | 115 GW | 170 GW |
| United States | 739 GW of wind and solar by 2030 to reach zero-carbon electricity by 2035 | 34 GW | 35 GW | 69 GW | 11 GW | 21 GW | 32 GW |
| United Kingdom | 60% renewables by 2030 | 4 GW | 3 GW | 7 GW | 4 GW | 1 GW | 5 GW |
| European Union | REPowerEU: 42.5% renewables by 2030 | 38 GW | 48 GW | 86 GW | 16 GW | 38 GW | 54 GW |
Source: National Public Utilities Council via Decarbonization Channel
The push to move towards more renewable sources of energy represents a significant required investment. The International Energy Agency states that the global installed capacity of renewables must triple by 2030 to limit the rise in global temperatures to 1.5°C. This brings us to the investments that must be made to achieve this goal. As we can see in the chart below, global clean energy investment is projected to total US$5.6 trillion between 2022 and 2030. By 2030, solar energy investment is projected to reach US$2.3 trillion between Utility Scale Solar (large-scale solar farms) and Distributed Solar (small-scale solar systems installed at point of consumption) and representing a total 49% of the projected US$5.6 trillion. Onshore Wind represents the next largest investment at US$1.1 trillion followed by Offshore Wind at US$774 billion, then Other Renewables at US$557 billion, and finally Energy Storage at US$374 billion. This massive shift towards renewable energy represents a strong revenue potential for Canada as a producer of many raw materials used for renewable energy sourcing and storage.
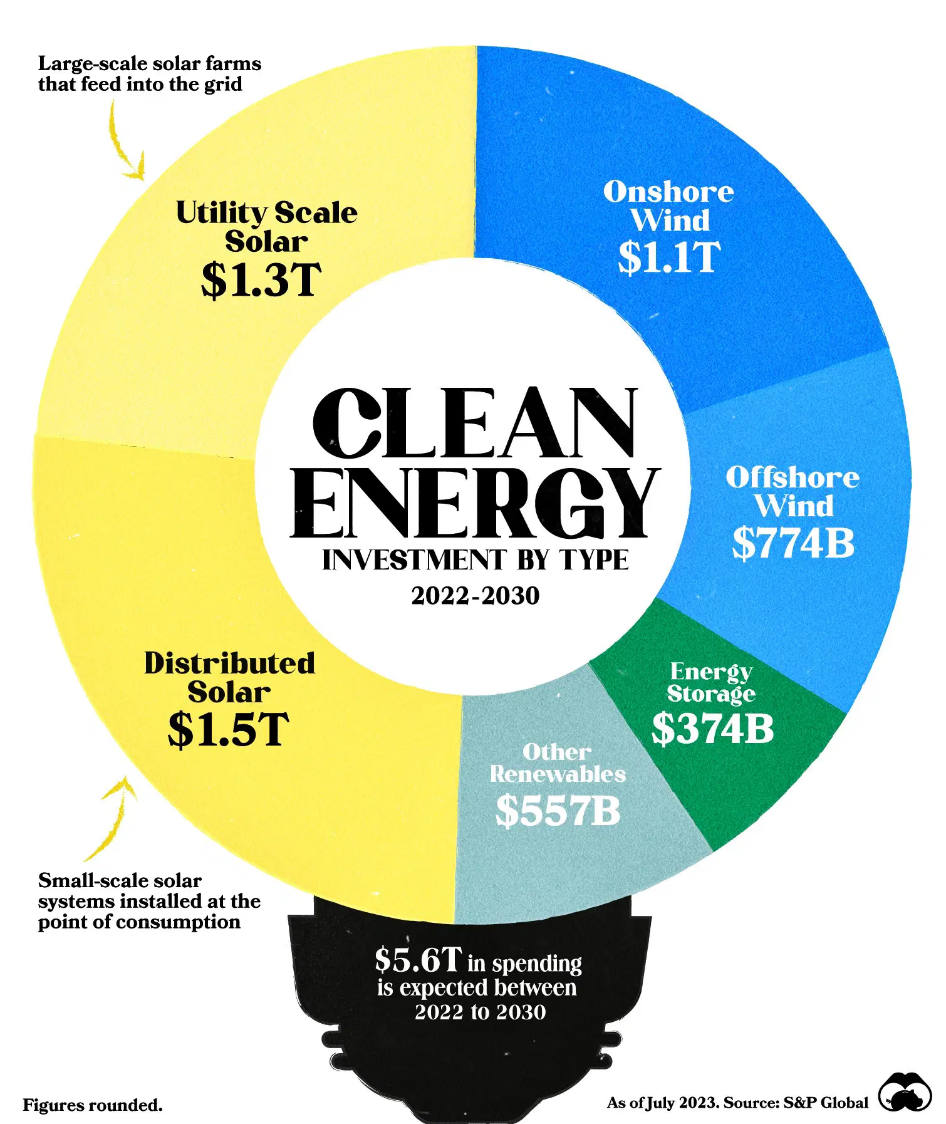
Source: S&P Global via Visual Capitalist
Sources: CNBC.com, Globe and Mail, Financial Post, Bloomberg, Thomson Reuters, Richardson Wealth, Refinitiv, S&P Global, Visual Capitalist, National Public Utilities Council, Decarbonization Channel, Government of Canada
©2024 Milestone Wealth Management Ltd. All rights reserved.
DISCLAIMER: Investing in equities is not guaranteed, values change frequently, and past performance is not necessarily an indicator of future performance. Investors cannot invest directly in an index. Index returns do not reflect any fees, expenses, or sales charges. Opinions and estimates are written as of the date of this report and may change without notice. Any commentaries, reports or other content are provided for your information only and are not considered investment advice. Readers should not act on this information without first consulting Milestone, their investment advisor, tax advisor, financial planner or lawyer. This communication is intended for Canadian residents only and does not constitute as an offer or solicitation by anyone in any jurisdiction in which such an offer is not allowed.