Market Insights: November Momentum & December Seasonality
Milestone Wealth Management Ltd. - Dec 02, 2023
Macroeconomic and Market Developments:
- North American markets were positive this week. In Canada, the S&P/TSX Composite Index rose 1.74%. In the U.S., the Dow Jones Industrial Average increased 2.42% and the S&P 500 Index inched ahead by 0.77%.
- The Canadian dollar rallied this week, closing at 74.10 cents vs 73.33 cents USD last Friday, to hit its highest level since late September.
- Oil prices were negative this week. U.S. West Texas crude closed at US$74.28 vs US$75.54 and the Western Canadian Select price closed at US$50.96 vs US$52.10 last Friday.
- The price of gold broke out to a new all-time closing high this week, closing at US$2,071 vs US$2,000 last Friday, beating the previous highest close back in August of 2020.
- The Canadian economy unexpectedly shrank in the third quarter, posting a -1.1% Real (above inflation) GDP annualized pace. However, the Q2 GDP reading was revised upwards from -0.2% to +1.4%. Meanwhile, the U.S. economy grew at an even stronger pace than previously indicated in the third quarter. Real GDP expanded at a 5.2% annualized pace, above the 4.9% originally estimated.
- Sadly, on Tuesday Charlie Munger, the billionaire investing sage and Warren Buffett’s right-hand man at Berkshire Hathaway (BRK.b), passed away at the age of 99. In addition to being Berkshire vice chairman, Munger was a real estate attorney, chairman and publisher of the Daily Journal Corp., a member of the Costco board, a philanthropist and an architect.
- Black Friday e-commerce spending in the U.S. rose by 7.5% compared to last year, reaching a record $9.8 billion. Additionally, Cyber Monday sales in the U.S. reached a record $12.4 billion, a 9.6% increase from last year, marking the largest online shopping day ever. The trend highlights a shift in consumer behaviour, with online sales growing more than in-store sales.
- Canadian tech company Open Text (OTEX) announced it has agreed to sell its Application Modernization and Connectivity (AMC) business to Rocket Software, a company owned by Bain Capital, for US$2.28 billion in cash. OTEX said the sale will allow it to expand its focus on cloud computing and AI, while bringing more predictable growth and cutting debt and offering it the ability to buy back shares in the future.
- Canada’s employment numbers for November were released on Friday. The Labour Force Survey showed Canada added 25,000 jobs last month, higher than estimates looking for a gain of 10,000. The unemployment rate ticked up to 5.8% from 5.7%, and is now at a 22-month high.
- Canada’s major banks released earnings this week:
- Bank of Nova Scotia (BNS) reported earnings on Tuesday that were lower than expected. Quarterly earnings came in at $1.26/share vs $1.65/share expected, although revenue beat expectations at $8.31 billion vs $8.21 billion forecast. The bank reported provisions for credit losses was $1.26 billion, an increase of $727 million.
- On Thursday, CIBC (CM) reported better than expected earnings of $1.57/share vs $1.53/share forecast, however revenue came in light at $5.84 billion vs $5.95 billion forecast. Provisions for credit losses was $541 million.
- Royal Bank of Canada (RY) also beat earnings expectations at $2.78/share vs $2.62/share expected, although revenue missed expectations with $13.03 billion vs $13.18 billion expected.
- Toronto-Dominion Bank (TD) earnings came in below forecast, with earnings of $1.83/share vs $1.90/share expected; however, revenue beat expectations at $13.19 billion vs $12.36 billion expected. TD also announced it is cutting 3,000 jobs and will take a $266 million charge for the restructuring.
- And on Friday, Bank of Montreal (BMO) reported mixed Q4 results with earnings coming in light at $2.81/share vs $2.87/share forecast, with provisions for credit losses of $446 million, and increased its dividend by 2.7%.
- National Bank of Canada (NA) came in above forecasts with $2.44/share earnings vs $2.26/share expected, adjusted revenue of $2.76 billion vs $2.64 billion expected, and raised its dividend by 3.9%.
Weekly Diversion:
Check out this video: The Biggest Stadiums Under Construction
Charts of the Week:
The S&P 500 snapped a three-month losing streak in November, rising 8.9% and posting the best months of returns since July 2022. The following chart shows that November 2023 was the 18th best monthly return for the S&P 500 Index since 1950. It also highlights how these strong monthly performances have typically been followed by strong forward returns as shown by the average performances for these top performing months compared to the all-month average. In the very short-term of one to three months, the performance offers minor differences, but when we shift to a longer-term view, we can see a significant outperformance. The 1-, 3-, and 5-year forward periods averaged returns of 16.7%, 45.4%, and 94.7% respectively which is a +4.2%, +4.2%, and +17.6% differential over all-month averages.
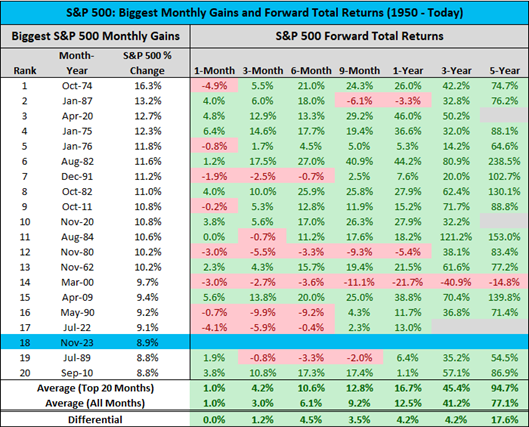
Source: Creative Planning, Charlie Bilello, via The Chart Report
With strong momentum from November carrying into December, let’s look at how this has specifically affected the last month of the year historically. The next chart observes the performance of the S&P 500 in December based on varying past performance levels for the month of November and year-to-date (YTD). As the chart illustrates, the average return for the month of December since 1928 has been 1.29% with positive returns 73.7% of the time (December is typically one of the stronger months). When we observe different November performances, we can see how this momentum has tended to carry through to the end of the year. Historically, the S&P 500 has averaged less impressive returns of 0.53% in December with positive returns 63% of the time when November was up at least 5%. However, in years when the S&P 500 was up 15% or more YTD like this year, independent of November’s performance, it resulted in average December returns of 1.78% and positive returns 75.9% of the time which is very impressive. Finally, years like this year with both a 5%+ gain in November and a 15%+ YTD gain through the end of November have likewise averaged a stronger-than-normal 1.4% gain with positive performance two-thirds of the time. It is important to note the number of occurrences in each of these scenarios can have an effect on average returns (as represented by the bracketed ‘N’ number). For example, years when the S&P 500 was up 15%+ YTD occurred 29 times in history vs. only nine prior occurrences where there were both a 5%+ gain in November and a 15%+ YTD gain through the end of November.
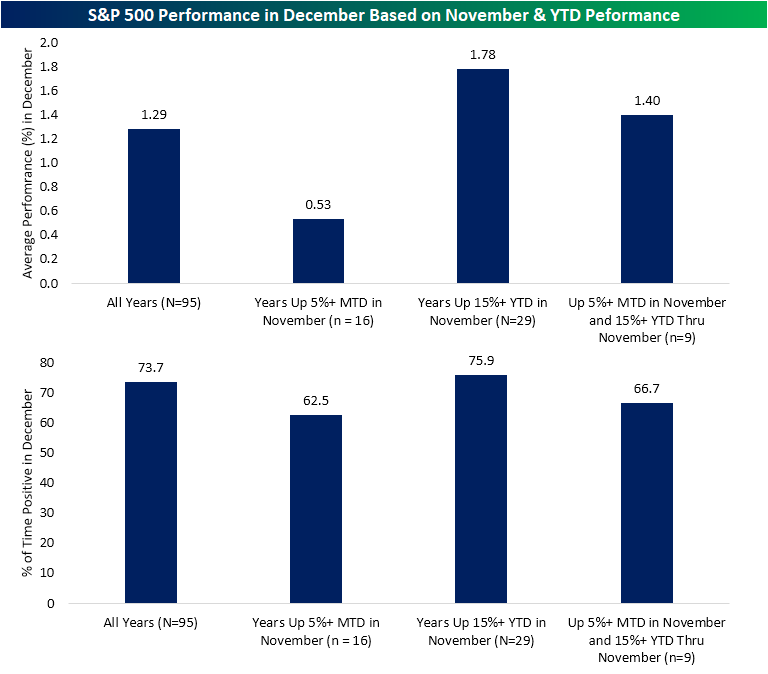
Source: Bespoke Investment Group
Finally, the last chart pivots away from the S&P 500 and focuses instead on the Dow Jones Industrial Average (US blue chip large-cap index). The chart shows that December has been a strong month for the Dow, posting average returns of 1.52%, 1.43% and 1% over the last 100, 50 and 20 years, with positive returns 74%, 70% and 65% of the time, respectively.
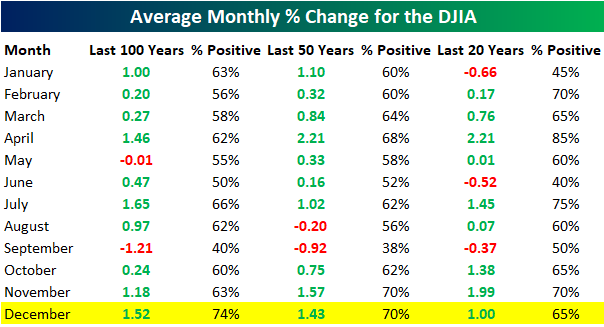
Source: Bespoke Investment Group
December has been a strong month for equities in general, especially when focusing on the S&P 500. However, strong YTD and November momentum carried into the last month of the year has historically shown to have a beneficial impact (much better than average) on forward returns. Time will tell if this most recent momentum will continue in December and the first part of 2024, but we are all hoping for a Santa Claus rally this year.
Sources: CNBC.com, Globe and Mail, Financial Post, Bloomberg, Thomson Reuters, Refinitiv, Creative Planning, Charlie Bilello, The Chart Report, Bespoke Investment Group
©2023 Milestone Wealth Management Ltd. All rights reserved.
DISCLAIMER: Investing in equities is not guaranteed, values change frequently, and past performance is not necessarily an indicator of future performance. Investors cannot invest directly in an index. Index returns do not reflect any fees, expenses, or sales charges. Opinions and estimates are written as of the date of this report and may change without notice. Any commentaries, reports or other content are provided for your information only and are not considered investment advice. Readers should not act on this information without first consulting Milestone, their investment advisor, tax advisor, financial planner or lawyer. This communication is intended for Canadian residents only and does not constitute as an offer or solicitation by anyone in any jurisdiction in which such an offer is not allowed.