Market Insights: S&P 500 Rally and Positive Indicators
Milestone Wealth Management Ltd. - Nov 18, 2023
Macroeconomic and Market Developments:
- North American markets were positive this week. In Canada, the S&P/TSX Composite Index rose 2.65%. In the U.S., the Dow Jones Industrial Average increased 1.94% and the S&P 500 Index advanced 2.24%.
- The Canadian dollar rallied this week, closing at 72.92 cents vs 72.48 cents last Friday.
- Oil prices were negative this week. U.S. West Texas crude closed at US$75.80 vs US$77.34 and the Western Canadian Select price closed at US$47.49 vs US$50.04 last Friday.
- The price of gold improved this week, closing at US$1,980 vs US$1,937 last Friday.
- In October, U.S. inflation showed signs of easing, which the markets interpreted as a positive. The Consumer Price Index (CPI) was flat for the month of October and rose 3.2% from a year earlier, slightly below the estimated 3.3%. Core CPI, excluding volatile food and energy costs, increased by 0.2% for the month and increased by 4.0% year-over-year, below the anticipated 4.1%.
- Teck Resources (TECK.b) announced it has agreed to sell its entire interest in its steelmaking coal business, Elk Valley Resources. The sale of a majority stake will be made to Glencore plc (GLEN.LN) with a minority stake going to Nippon Steel Corporation, for a total implied enterprise value of $9.0 billion.
- Target (TGT) on Wednesday topped Wall Street’s quarterly sales expectations and blew past earnings estimates, as purchases in high-frequency categories like food and beauty helped prop up weaker customer spending. Earnings came in at $2.10/share vs $1.48/share expected on revenue of $25.40 billion vs $25.24 billion expected. The stock price was up 17.75% on Wednesday as a result.
- Meanwhile, on Thursday, Walmart (WMT) released earnings that beat estimates, with earnings of $1.53/share vs $1.52/share expected on revenue of $160.80 billion vs $159.72 billion expected. Despite the positive results, the company offered a cautious outlook on consumer spending going forward. As a result, the stock dropped 8.09% on Thursday.
- Parkland (PKI), owner of Fas Gas and a chain of gas station/convenience stores, announced it has secured up to $210 million of financing from the Canada Infrastructure Bank to build out its EV charging network. The CIB has provided an 18-year financing facility with terms that include principal repayments tied to utilization of the installed EV chargers and it will fund up to 80% of capital deployed to install the chargers over four years.
Weekly Diversion:
Check out this video: World’s Biggest YouTube Star Builds 100 Water Wells in Africa
Charts of the Week:
The S&P 500 has experienced a significant rally in November, with a 7.64% gain following a three-month losing streak. This surge is attributed to various factors, including cooling inflation, Fed sentiment indicating a possible end to rate increases, and improved retail trading sentiment. As we can see in the chart below, stocks of the S&P 500 are set to end the third straight week of positive returns, marking the longest weekly rally since July of this year. It is also important to note that the single highest 1-week return also occurred in the first week of November.
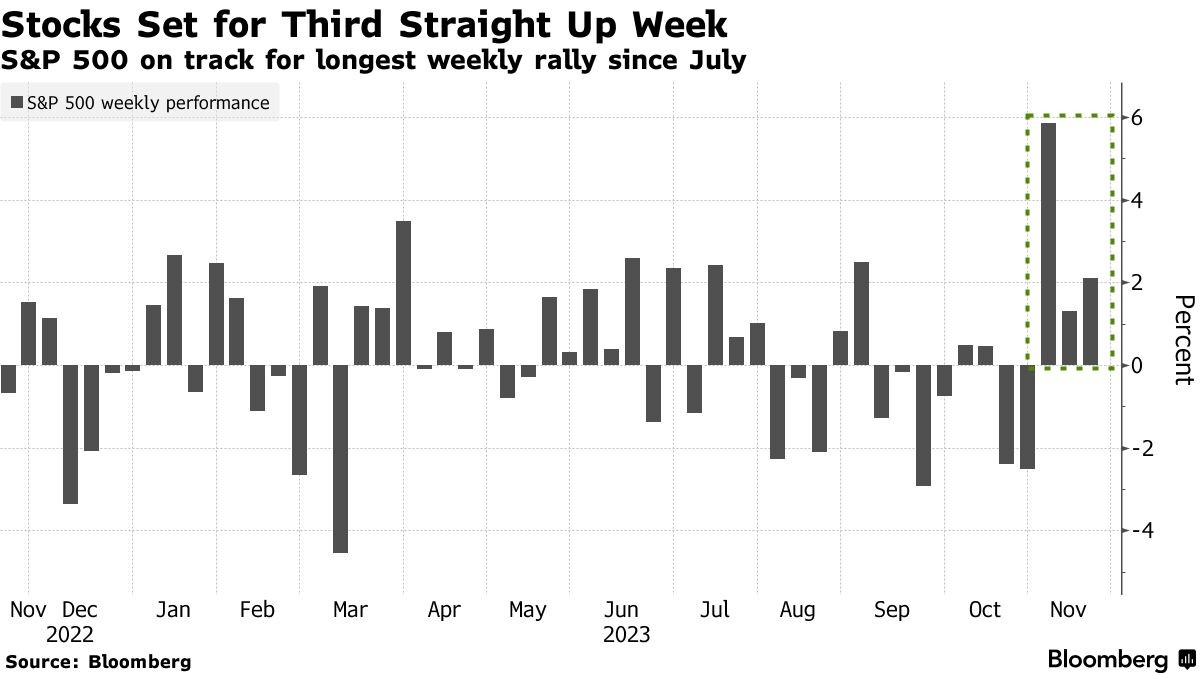
Source: Bloomberg
November has seen a significant improvement in market breadth, posting a ratio of over 9-times for advancing stocks vs declining stocks in the NYSE and the highest ratio since before the Covid-19 pandemic, as shown in the chart below. Market breadth refers to a set of technical indicators that evaluate the price advancement and decline of a given stock index. These indicators are mathematical formulas used to measure how many stocks are rising and falling within an index, as well as their trading volume, and provide insights into market sentiment, predict potential future price movements, and assess the strength of an upward or downward price trend. The 9-1 ratio of advancing vs decreasing stocks is an important factor when considering since 1996, there have only been 16 prior occurrences resulting in the S&P 500 posting an average gain of 1% one month later, 14% six months later, and 22% over the next year.
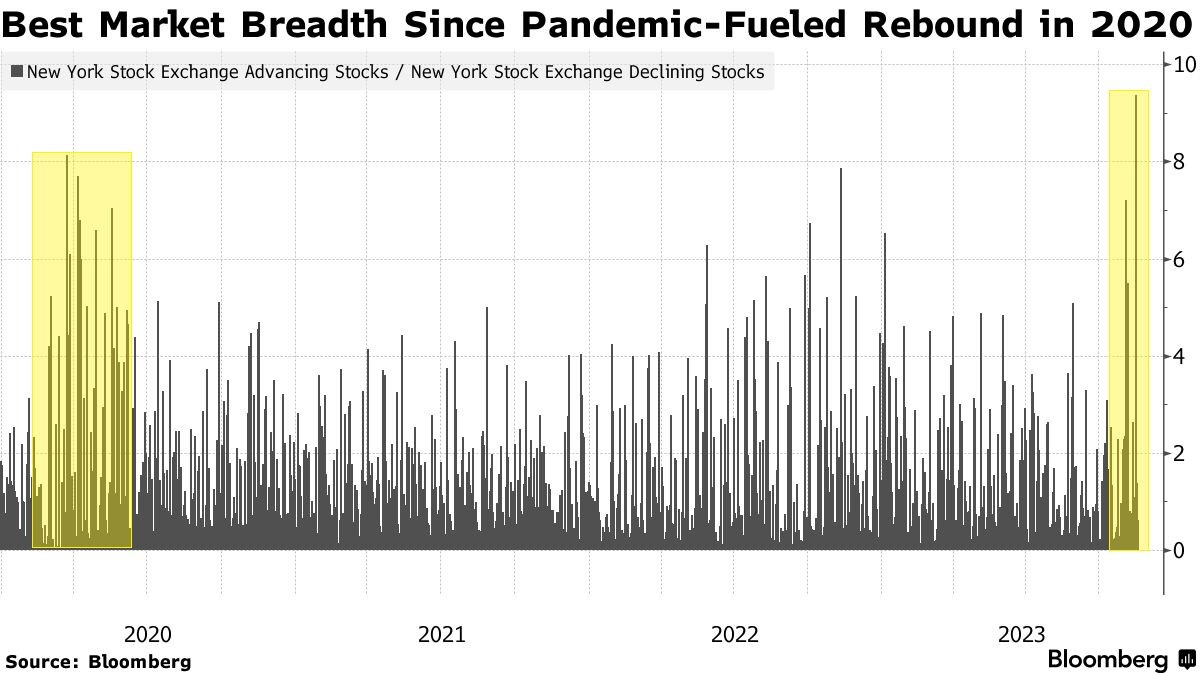
Source: Bloomberg
Finally, it should come as no surprise that retail trader sentiment has seen a rebound in November. As shown in the following chart, the AAII (American Association of Individual Investors) US Investor Sentiment Survey posted the highest positivity ratio since August and although this ratio is not the highest this year, it is a welcomed sight after the extremely negative ratios of September and October.
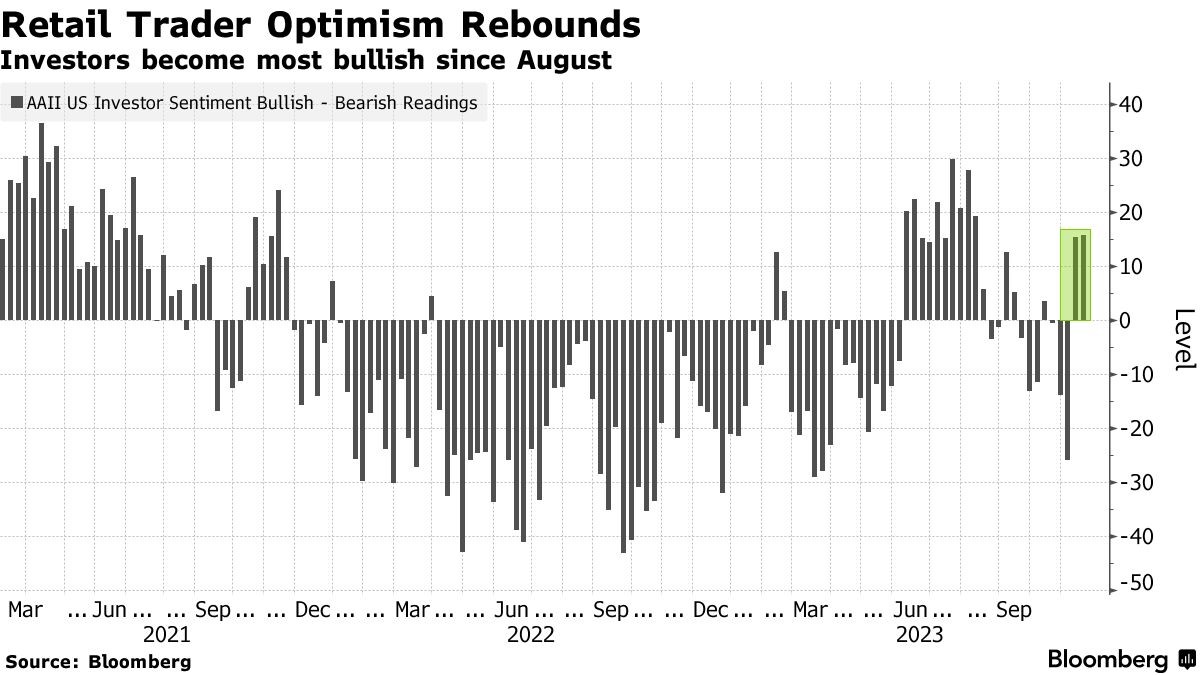
Source: Bloomberg
Sources: CNBC.com, Globe and Mail, Financial Post, Bloomberg, Thomson Reuters, Refinitiv, Forbes Advisor
©2023 Milestone Wealth Management Ltd. All rights reserved.
DISCLAIMER: Investing in equities is not guaranteed, values change frequently, and past performance is not necessarily an indicator of future performance. Investors cannot invest directly in an index. Index returns do not reflect any fees, expenses, or sales charges. Opinions and estimates are written as of the date of this report and may change without notice. Any commentaries, reports or other content are provided for your information only and are not considered investment advice. Readers should not act on this information without first consulting Milestone, their investment advisor, tax advisor, financial planner or lawyer. This communication is intended for Canadian residents only and does not constitute as an offer or solicitation by anyone in any jurisdiction in which such an offer is not allowed.