Market Insights: Don’t Lose Faith Through October Lows
Milestone Wealth Management Ltd. - Nov 03, 2023
Macroeconomic and Market Developments:
- North American markets were very strong this week, closing out the best week of returns for the year. In Canada, the S&P/TSX Composite Index increased 5.49%. In the U.S., the Dow Jones Industrial Average rose 4.83% and the S&P 500 Index rallied 5.53%.
- The Canadian dollar improved this week, closing at 73.23 cents vs 72.07 cents USD last Friday.
- Oil prices were down this week. U.S. West Texas crude closed at US$80.79 vs US$85.11 vs and the Western Canadian Select price closed at US$57.00 vs US$66.05 last Friday.
- The price of gold decreased this week, closing at US$1,992 vs US$2,006 last Friday.
- This week it was the U.S. central bank’s turn in the spotlight. The U.S. Fed announced on Wednesday that it chose to hold interest rates at its target range of 5.25 – 5.50%. This was the second consecutive meeting in which the Federal Open Market Committee chose to hold rates, following a string of 11 rate hikes, including four in 2023.
- Canada’s economy continues to show that it has stalled out or is in a mild recession. Canada’s GDP was essentially unchanged in August as services-producing industries edged up 0.1% while goods-producing industries contracted 0.2%. Additionally, Statistics Canada reported that an estimate for GDP was essentially unchanged in September, suggesting that the third quarter of 2023 was essentially flat.
- Canadian Tire Corp (CTC.a) announced that it has completed the repurchase of Scotiabank's 20% stake in Canadian Tire Financial Services. The all-cash transaction, valued at $895 million, restores Canadian Tire’s full ownership of its financial services arm and the company will record a charge of $328 million related to the transaction.
- Calgary-based Canadian Natural Resources (CNQ) reported quarterly earnings of $2.59/share vs $2.42/share expected and production of 1,393.6 MBoe/d vs 1,392.1 MBoe/d expected. The company announced it will be increasing its quarterly dividend by 11.1% to $1.00/share. Additionally, the company announced that Scott Stauth has been promoted to president.
- Apple (AAPL), the world’s largest publicly traded company, reported earnings after the close of the markets on Thursday. While the company beat earnings and revenue expectations, this was the fourth consecutive quarter of declining sales. Earnings came in at $1.46/share vs $1.39/share expected on revenue of $89.50 billion vs $89.28 billion expected, and the all-important iPhone revenue matched expectations with $43.81 billion in sales.
- Employment numbers for October were released on Friday. In Canada, our economy added 17,500 jobs in October, while the jobless rate rose 0.2% to 5.7%, the fourth monthly increase in the past six months. In the United States, non-farm payrolls increased by 150,000 for the month, below the forecast for a rise of 170,000. The unemployment rate rose from 3.8% to 3.9%, the highest level since January 2022.
Weekly Diversion:
Check out this video: Riding First Class
Charts of the Week:
August, September, and October were exceedingly difficult months for equities with the S&P 500 Index and S&P/TSX Composite falling 8.6% and 8.5% respectively on a price basis over that period. Despite the large correction, this week kicked off a strong recovery to end the month of October and it has carried through to the end of the week with the S&P 500 closing up 5.53% for the week, the largest weekly increase for 2023. This may come as no surprise given how oversold markets were and the strength of equities in general during the month of November, being the best month on average since 1950, the second-best month in the past 10 years, and the third-best month in the past 20 years. The following chart, which we included last week, shows the average calendar performance during these different periods, highlighting November.
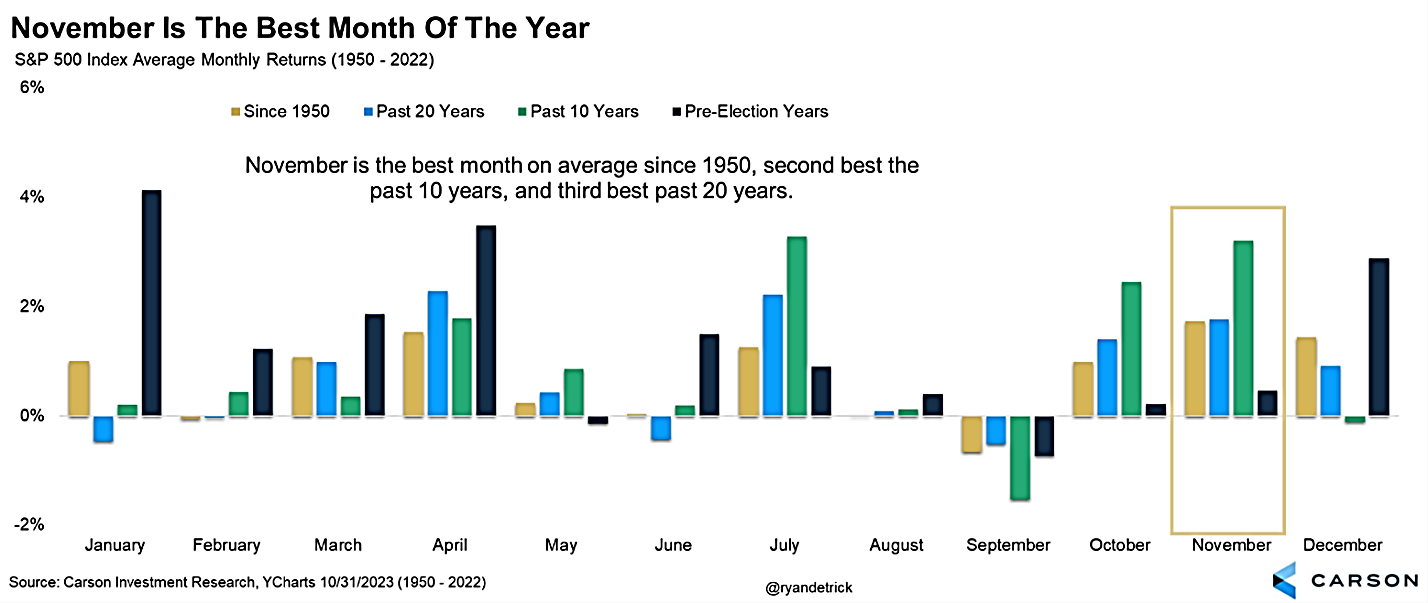
Source: Carson Investment Research, YCharts, @RyanDetrick
As the title of the next chart suggests, three consecutive months of poor performance for August, September, and October is not necessarily a reason to panic and lose faith in the markets. As illustrated in the next table, there have been only five previous occurrences where the S&P 500 posted consecutive negative returns in August, September, and October since 1950. In all five of these instances, the S&P 500 was positive 100% of the time in November, averaging a return of 3.7% (median 3.4%). Moving forward to December, the average return for these occurrences was 0.8% (median 1.8%) and were positive 80% of the time. Most impressive is the return for the final two months combined averaging a return of 4.5% (median 5.3%). It is important to note that for 1957, the U.S. was wrapping up a recession that started in 1956 which had severely affected markets.

Source: Carson Investment Research, FactSet, @RyanDetrick
This year finds itself in a more common market trend of positive year-to-date returns, but with a negative October. As we discussed last week, October can be misunderstood though it has provided more than its fair share of corrections. The next table shows that there have been 18 prior times since 1950 where the S&P 500 was up year-to-date with a negative October, and as we can see, the index has fared very well moving into November and to close out the year. In these prior instances, November has averaged a return of 2.4% with positive returns 72.2% of the time, and the final two months of the year have produced average returns of 4.8% and positive returns 88.9% of the time. Time will tell if this trend continues, but the strong performance we have seen so far to start November is certainly optimistic.
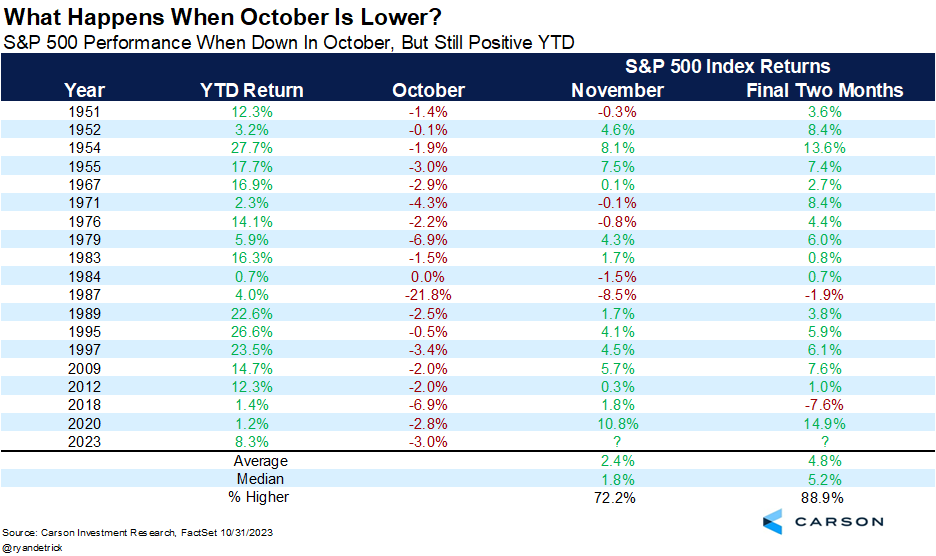
Source: Carson Investment Research, FactSet, @RyanDetrick
Sources: CNBC.com, Globe and Mail, Financial Post, Bloomberg, Thomson Reuters, Refinitiv, Carson Investment Research, FactSet, @RyanDetrick, YCharts, Forbes Advisor
©2023 Milestone Wealth Management Ltd. All rights reserved.
DISCLAIMER: Investing in equities is not guaranteed, values change frequently, and past performance is not necessarily an indicator of future performance. Investors cannot invest directly in an index. Index returns do not reflect any fees, expenses, or sales charges. Opinions and estimates are written as of the date of this report and may change without notice. Any commentaries, reports or other content are provided for your information only and are not considered investment advice. Readers should not act on this information without first consulting Milestone, their investment advisor, tax advisor, financial planner or lawyer. This communication is intended for Canadian residents only and does not constitute as an offer or solicitation by anyone in any jurisdiction in which such an offer is not allowed.