Market Insights: Is October Misunderstood?
Milestone Wealth Management Ltd. - Oct 27, 2023
Macroeconomic and Market Developments:
- North American markets were down this week. In Canada, the S&P/TSX Composite Index dropped 1.98%. In the U.S., the Dow Jones Industrial Average fell 2.14% and the S&P 500 Index was down 2.53%.
- The Canadian dollar decreased this week, closing at 72.07 cents vs 72.94 cents last Friday.
- Oil prices were mixed this week. U.S. West Texas crude closed at US$85.11 vs US$88.75 vs and the Western Canadian Select price closed at US$66.05 vs US$64.99 last Friday.
- The price of gold rallied again this week, fueled by geopolitical concerns, closing at US$2,006 vs US$1,979 last Friday.
- The week kicked off with another blockbuster deal in the U.S. oilpatch, with Chevron (CVX) announcing on Monday that it has agreed to buy Hess (HES) for $53 billion in stock ($60 billion including the assumption of debt). Chevron has offered 1.025 of its shares for each Hess share, or $171/share, implying a premium of about 4.9% to the stock’s last close. The acquisition will give Chevron a significant foothold in Guyana, the South American country that is one of the world’s newest oil producers.
- The Bank of Canada met this week, electing to hold its overnight interest rate at 5.0%. According to the central bank’s press release, “the global economy is slowing and growth is forecast to moderate further as past increases in policy rates and the recent surge in global bond yields weigh on demand. The Bank projects global GDP growth of 2.9% this year, 2.3% in 2024 and 2.6% in 2025”.
- Consumer confidence slipped into negative territory for the first time in more than six months, with the Bloomberg Nanos Canadian Confidence Index falling to 49.5 (a level below 50 suggests net negative views about the economy). This is the lowest reading since April and compares with the high this year of 53.1 reported in early June. The BoC's aggressive interest rate hikes, among other factors, have kept buyers out of the housing market, which has weighed on consumer sentiment.
- The U.S. economy continues to grow, with Real (above inflation) GDP increasing at a 4.9% annual rate in the third quarter, above the expected 4.5%. The largest positive contributions to Real GDP growth came from personal consumption, inventories, and government purchases.
- Earnings were released from high profile U.S. tech companies this week:
- On Tuesday, Microsoft (MSFT) reported strong results, with earnings of $2.99/share vs $2.65/share expected on revenue of $56.52 billion vs $54.50 billion expected.
- Also on Tuesday, Google and YouTube parent Alphabet (GOOGL) reported earnings of $1.55/share vs $1.45/share expected on revenue of $76.69 billion vs $75.97 billion expected, however the stock dropped 9.6% on Wednesday as the cloud business missed analysts’ estimates.
- On Wednesday, Facebook and Instagram parent Meta Platforms (META) reported earnings of $4.39/share vs $3.63/share expected on revenue of $34.15 billion vs $33.56 billion expected and daily active users (DAUs) of 2.09 billion vs 2.07 billion expected.
- And on Thursday, Amazon (AMZN) reported earnings per share of $0.98/share vs $0.58/share expected on revenue of $143.1 billion vs $141.4 billion expected.
- Canadian Pacific Kansas City (CP) reported better than expected adjusted earnings of $0.92/share vs $0.91/share expected, however came in light on revenue at $3.34 billion vs $3.37 billion expected. The railway provided guidance for full year adjusted earnings to be flat to slightly positive year over year, lower than previous guidance of being up mid-single-digits.
Weekly Diversion:
Check out this video: Rescue beaver makes Christmas dam in house
Charts of the Week:
October 2023 has been a difficult month for global equities so far, extending the correction that started in August. This month has had a reputation as being the month with the largest historical declines. This is also known as the October Effect, which is a psychological anticipation that large stock market declines are more likely to occur during this month than any other. The Black Monday stock crash of 1987 and the waterfall decline in October 2008 during the Global Financial Crisis come to mind. However, when looking at the overall data, it is not necessarily a bad month when we observe average historical returns. In the past 20 years, the S&P 500 Index has had an average return of well over 1% in October, making it the 4th best month of the year over this period (not quite as strong over the last 50 years). October has also seen significant gains, such as a 16% increase in 1974, an 11% increase in 1982 and 2011, and even lately with 5% gains in 2021 and 2022. October becomes even more impressive when we observe the performance of the S&P 500 over the past 10 years, ranking as the 3rd best month of the year. While it is unlikely that this October will close with a positive return, there are some positive seasonal factors at play from late October to early May.

Source: Carson Investment Research, YCharts
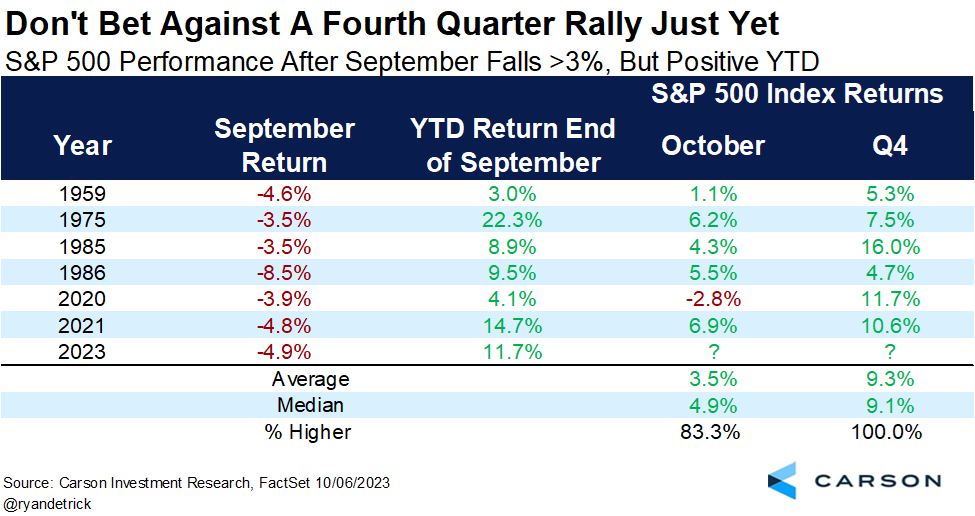
Moving past a late October rally that may not occur this year, there is reason for optimism when observing more specific historical S&P 500 September drawdowns and fourth quarter rallies. As the following chart illustrates, there have been six prior times since 1950 where the S&P 500 was down more than 3% for the month of September (like this year) but was still positive year-to-date heading into October. For these six occurrences, only one of them had a negative October (likely two after this month). However, all these past occurrences ended with a positive fourth quarter with an impressive average quarterly return of 9.3%, which is more than double the average fourth quarter return (4.2%) since 1950. Barring a significant rally in the last two days of October which seems unlikely, we can perhaps find some hope that this year will be like 2020, when October declined 2.8% but saw a last quarter rally of 11.7%, almost three times larger than average.

Source: Ryan Detrick, Carson Investment Research, FactSet
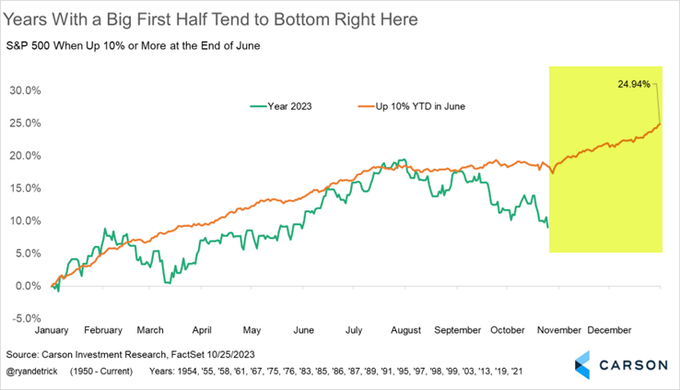
The last chart below shows the composite return (orange line) of the S&P 500 Index since 1950 when it was up over 10% at mid-year like it was this year. There have been 22 of these occurrences, most recently in 2021 and 2019. The yellow section highlights the months of November and December over these years typically inflecting upwards and finishing the year strong. While September and October have not fared well this year, this reinforces the strength of the historically strong fourth quarter in general. We can see that the orange line has tended to see some consolidation in the third quarter of these years, before a strong rally to end the year, averaging a return of 24.94% for the calendar year. Time will tell if 2023 trends in the same direction.

Source: Ryan Detrick, Carson Investment Research, FactSet
Sources: CNBC.com, Globe and Mail, Financial Post, Bloomberg, Thomson Reuters, Refinitiv, Ryan Detrick - Carson Investment Research, FactSet
©2023 Milestone Wealth Management Ltd. All rights reserved.
DISCLAIMER: Investing in equities is not guaranteed, values change frequently, and past performance is not necessarily an indicator of future performance. Investors cannot invest directly in an index. Index returns do not reflect any fees, expenses, or sales charges. Opinions and estimates are written as of the date of this report and may change without notice. Any commentaries, reports or other content are provided for your information only and are not considered investment advice. Readers should not act on this information without first consulting Milestone, their investment advisor, tax advisor, financial planner or lawyer. This communication is intended for Canadian residents only and does not constitute as an offer or solicitation by anyone in any jurisdiction in which such an offer is not allowed.