Market Insights: S&P 500 Seasonal Strength Ahead
Milestone Wealth Management Ltd. - Oct 20, 2023
Macroeconomic and Market Developments:
- North American markets were down this week. In Canada, the S&P/TSX Composite Index decreased 1.78%. In the U.S., the Dow Jones Industrial Average declined 1.61% and the S&P 500 Index fell 2.39%.
- The Canadian dollar devalued this week, closing at 72.94 cents vs 73.19 USD cents last Friday.
- Oil prices were mixed this week. U.S. West Texas crude closed at US$88.75 vs US$90.81 and the Western Canadian Select price closed at US$64.99 vs US$64.68 last Friday.
- The price of gold rose significantly this week, closing at US$1,979 vs US$1,928 last Friday.
- Tourmaline Oil (TOU) announced an agreement Monday to buy Bonavista Energy in a deal worth $1.45 billion. Under the acquisition, Tourmaline will pay $725 million in shares and $725 million in cash, less Bonavista's net debt at closing. Tourmaline said the deal represents an important component of the company's ongoing consolidation strategy, adding decades of inventory and supplementing its existing Deep Basin assets in Alberta.
- Canada’s inflation rate slowed last month, with the Consumer Price Index (CPI) coming in at 3.8% year over year, following the 4.0% annual reading in August. The slower pace stemmed from lower prices for some travel-related services, durable goods and groceries.
- Shares of Lululemon (LULU) surged on Monday after the announcement that it will be added to the S&P 500 Index. The stock finished up 10.3% on the day, closing at its highest level since December 2021.
- Morgan Stanley’s (MS) third-quarter earnings slid amid sluggish results from the firm’s investment bank and a miss in wealth management. On the trading side, fixed-income revenue slumped 11% and, along with muted fees from dealmaking, caused a drop in net income. Revenue of $6.4 billion from the firm’s wealth-management business missed analysts’ estimates, and net new assets slumped to $35.7 billion from $89.5 billion the prior quarter.
- Bank of Nova Scotia (BNS) is set to cut 3% of its workforce, amounting to about 2,700 jobs, as part of a restructuring effort under new CEO Scott Thomson. The bank will also take a $590 million charge in its fiscal fourth quarter. Thomson, who took over as CEO in February, has emphasized cost-cutting as a key focus, and the restructuring could include "end-to-end digitization" and centralizing its international unit.
- The net worth of the typical U.S. household grew at the fastest pace in more than three decades from 2019 through 2022, while relatively low interest rates at that time made it easier for households to pay their debts, according to a government report Wednesday. Wealth for the median household – the midpoint between the richest and poorest households – jumped 37% during those three years, the Federal Reserve reported, to nearly $193,000. (The figures are adjusted for inflation.) The increase reflected primarily a jump in home values and higher stock prices and a rise in the proportion of Americans who own homes and stocks.
- American Express Co.’s (AXP) third-quarter revenue and profit soared to record levels as the company continued to attract new cardholders willing to pay an annual fee for its premium products. Amex reported $15.4 billion in revenue, topping analyst estimates and surpassing the $13.6 billion it generated in the same period last year.
Weekly Diversion:
Check out this video: Just hanging out
Charts of the Week:
We are currently moving into a period that has historically resulted in strong returns for the S&P 500 Index. Although markets have been relatively weak since July, this provides some optimism that the seasonal tailwind may provide some support for equity markets. Earlier this week on October 16th, the 10-year median historical performance over the next three-month period hit the 100th percentile, which means the next three months after that date have historically been the best three months of the year over the past 10 years. As illustrated in the first chart, the next one-month period is also very high, sitting at the 97th percentile. The second chart below shows the SPY Annual Composite Chart (%) averaged over the past 20 years. SPY is an exchange-traded fund that tracks the S&P 500 Index. We can see that the blue line has historically, on average, bottomed out around mid-October then finished strong to end the year.


Source: Bespoke Investment Group
The one-month and three-month median historical performance landing in the 97th and 100th percentiles of best performing periods of the year is further reinforced when we observe the historical average returns of the S&P 500 Index by calendar month from 1970 to 2023 (YTD). The next chart shows that October, November, December, and January historically represent four of the five strongest performing months.
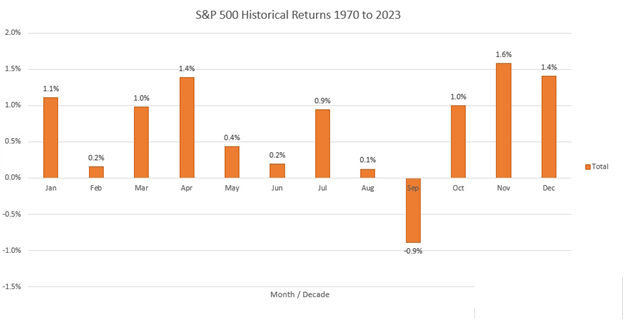
Source: Carson Investment Research
Sources: CNBC.com, Globe and Mail, Financial Post, Bloomberg, Thomson Reuters, Refinitiv, Carson Investment Research, Bespoke Investment Group
©2023 Milestone Wealth Management Ltd. All rights reserved.
DISCLAIMER: Investing in equities is not guaranteed, values change frequently, and past performance is not necessarily an indicator of future performance. Investors cannot invest directly in an index. Index returns do not reflect any fees, expenses, or sales charges. Opinions and estimates are written as of the date of this report and may change without notice. Any commentaries, reports or other content are provided for your information only and are not considered investment advice. Readers should not act on this information without first consulting Milestone, their investment advisor, tax advisor, financial planner or lawyer. This communication is intended for Canadian residents only and does not constitute as an offer or solicitation by anyone in any jurisdiction in which such an offer is not allowed.