Market Insights: Third Quarter Wrap-up
Milestone Wealth Management Ltd. - Oct 04, 2023
*For PDF version, please click here*
Key Updates on the Economy & Markets
Stocks and bonds were both affected by a chain of events during the third quarter. It started with rising oil prices, which caused inflation to re-accelerate in August. The rebound in inflation contributed to a sharp rise in interest rates, with the 10-year U.S Treasury yield rising above 4.50% and the equivalent Canadian 10-year government bond rate closing the quarter over 4.25%. The rise in interest rates pressured stock market valuations, and the S&P 500 finished the third quarter with a -3.27% total return in USD while the S&P/TSX Composite returned -2.2%.
Meanwhile, rising rates also hit bond markets hard, with the FTSE Canada Universe Bond Index falling 3.8%, pushing the broad Canadian fixed income market well into negative territory for the year on a total return basis.
Internationally, developed and emerging foreign equity markets both declined approximately 2% and 1% on the quarter in Canadian dollar total return terms. In currency markets, the Loonie fell 2.5% in the third quarter relative to the U.S. dollar. However, the U.S. Index, which is tracked against a larger basket of world currencies, gained over 3.2% due to a rise against the Pound, Euro and Yuan.
This letter recaps the third quarter, discusses the rise in oil prices and interest rates, and looks ahead to the fourth quarter of 2023.
Rising Oil Prices Reignite Inflation Fears
After trading lower during the past year, oil prices rose to a 12-month high during the third quarter. Figure 1 shows oil ended September above $90 per barrel after starting the quarter near $70. The steady climb in oil prices was attributed to a continued mismatch between demand and supply. Oil demand remains strong as the global economy continues to grow, while OPEC recently agreed to extend its production cuts through the end of 2023. Additionally, the US’s Strategic Petroleum Reserve sits at its lowest level since the 1980s, which leaves little capacity to mitigate potential supply disruptions. With OPEC’s production cuts squeezing global supply, oil prices surged nearly 30% in the third quarter.

The rise in oil prices caused inflation to re-accelerate in August, with gasoline prices accounting for over half of the monthly increase. While the rebound in inflation was widely expected, it focused attention back on the threat of persistent inflation. Oil's use as a transportation fuel means that it touches nearly every aspect of the economy, and a continued rise in oil prices could keep upward pressure on inflation as rising fuel costs are passed through to the end consumer. Inflation pressures have declined significantly during the past year, but as the recent rise in oil prices shows, the risk of inflation flare-ups remains high.
Treasury Yields Rise Sharply in the Third Quarter
The prospect of renewed inflation contributed to the rise in interest rates during the third quarter. Figure 2 graphs the change in various U.S. Treasury yields from June 30th to September 30th. As always, we focus on U.S. yields and economy with the greenback being the world’s reserve currency. On the left side of the chart, the yields for maturities of two years or less were relatively stable. These short-term yields are highly sensitive to U.S. Federal Reserve (Fed) policy, and the Fed’s only action was a 0.25% interest rate hike at the July meeting. Moving to the right, you’ll notice a sizable increase in yields on longer-maturity Treasury bonds. The 10-year and 30-year yields both rose by more than 0.75% since mid-year. The sharp rise in yields was a big development during the quarter. Excluding the pandemic, the last two times the 10-year yield rose by over 0.75% in a 3-month period were in 2013 and 2016.

What led to the rapid rise in Treasury yields? One contributing factor was the surge in oil prices and subsequent increase in inflation. Throughout the first half of 2023, investors believed that falling inflation would result in fewer interest rate hikes by the Fed and potentially quicker interest rate cuts. However, with the economy remaining stronger than expected and oil prices rising, there is a growing realization that the Fed may need to keep interest rates higher for longer to prevent inflation from becoming entrenched. The recent rise in yields indicates the market is preparing for a longer period of higher interest rates and fewer near-term rate cuts. Another contributing factor was the increased issuance of Treasury bonds. Following the debt ceiling resolution in May, the Treasury Department can now issue more bonds to fund the growing U.S. government deficit. Treasury bond issuance is forecast to increase in the coming quarters, and investors are concerned that the surge in supply will outpace investor demand and cause bond prices to decline.
Consumers Face Higher Borrowing Costs
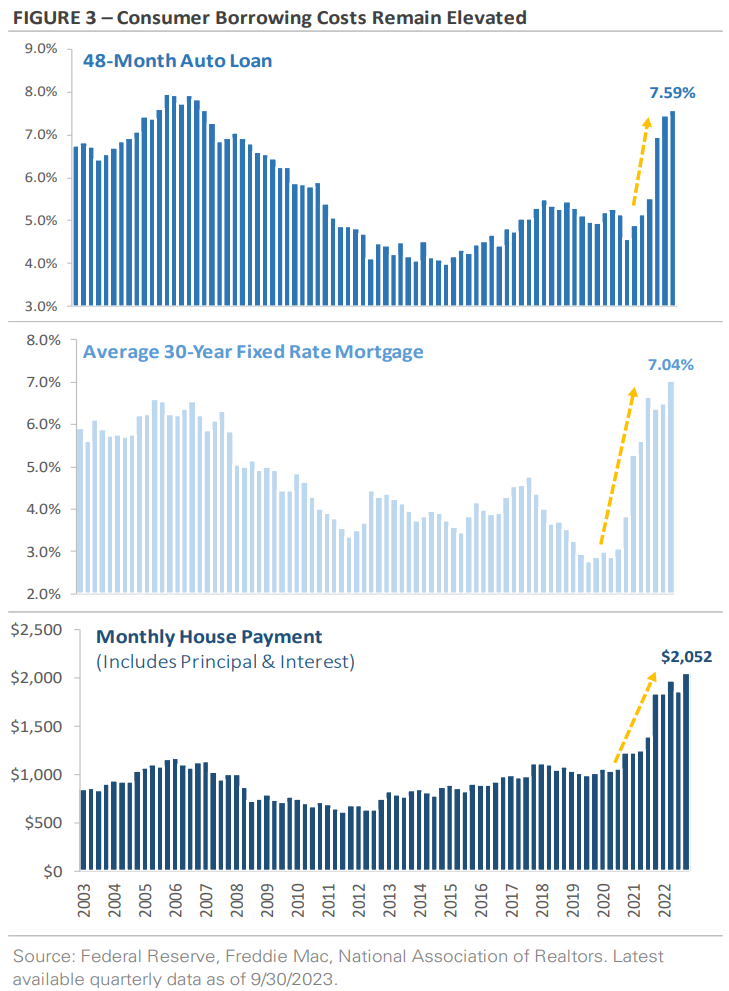
The stacked charts in Figure 3 on page 3 show the Fed’s series of interest rate hikes have led to a sharp rise in borrowing costs. The top chart shows the interest rate on a 48-month auto loan has risen from 4.6% at the end of 2021 to 7.6% at the end of June. The middle chart shows the average 30-year U.S. fixed-rate mortgage rose from 3.8% to 7% over the same period. The recent rise in Treasury yields pushed mortgage rates above 7.30% during the third quarter, which implies that interest rates on auto loans also increased over the past few months. Here in Canada, our standard mortgage is much different than in the U.S., where we typically have 5-year fixed rate mortgages amortized over 25 years compared to ones that are amortized over 30 years and have a fixed rate throughout. Still, the average 5-year fixed rate mortgages here have climbed well over 6% this year with the big five banks hovering around 6.5%.
The bottom chart illustrates how the rise in mortgage rates has affected the homebuying process. According to the National Association of Realtors, the monthly house payment in the U.S. has risen from $1,249 at the end of 2021 to $2,052 at the end of June. Factoring in the rise in mortgage rates during the third quarter, the current monthly house payment is likely much higher. While many homeowners locked in low mortgage rates during the past few years, today’s homebuyers are navigating a combination of higher mortgage rates and home prices that are still elevated.
It’s not just homebuyers and consumers who face higher borrowing costs. Borrowers of all types, including businesses and commercial real estate owners, are adjusting to a new world with higher interest rates. For some borrowers, the math of higher monthly payments doesn’t work like it used to when interest rates were lower during the past decade. The looming question is whether borrowers can manage the increased interest rates and maintain their payments.
Data already indicates consumers, businesses, and commercial property owners are feeling the stress of higher rates. The percentage of auto loan delinquencies, which is defined as loans 90 days or more overdue, is rising across every age group, and there is a similar trend in credit card delinquencies. The rising number of Chapter 11 bankruptcy filings suggests businesses are also feeling the effect of higher rates, while some commercial real estate owners have made the strategic decision to hand keys over to lenders rather than invest more money in undesirable buildings. These early signs of stress suggest lenders and investors should be mindful of potentially above-average credit risk in the coming years.
Equity Market Recap – S&P 500 Ends the Third Quarter with a Loss
Stocks traded down in the third quarter, with most of the losses occurring in August and September as rising interest rates weighed on equity market valuations. The S&P 500 ended the third quarter with a -3.3% return as noted previously, while the Russell 2000 Index of small cap companies returned -5.5%. The Nasdaq 100, which tracks growth stocks, returned -3.1%. These numbers are even lower in Canadian dollars.
Despite negative returns during the quarter, the major stock indices have still posted strong gains this year. The S&P 500 has returned 13.07% through the end of September, while the Nasdaq 100 has gained 34.51% this year. Unfortunately, as we have noted many times this year, this is mostly attributable to U.S. large cap technology and communication services companies which have rebounded from a terrible 2022. This divergence in returns is so pronounced that the S&P 500 Index in equal-weight terms is only up 1.33% total return and is actually negative in Canadian dollar terms. The S&P/TSX Composite here has lagged the U.S., posting only a 3.38% total return so far, this year. However, again, if you strip out the technology sector it is only up about 1%.
Moving down to the sector level, Energy was the top-performing sector in the third quarter as oil prices climbed nearly 30%. Communication Services was the only other sector to trade higher, while the remaining nine U.S. sectors in the posted single-digit losses. Defensive sectors underperformed as rising interest rates weighed on the Utility, Real Estate, and Consumer Staple sectors.
Like Canada, international stocks have also underperformed U.S. stocks. The MSCI EAFE Index of developed market stocks returned -2.03% in CAD in the third quarter, while the MSCI Emerging Market Index returned -0.82%. So far this year, they have posted CAD total returns of 6.5% and 1.6%, respectively. Year-to-date, international markets have underperformed relative to the U.S. due to their lower exposure to both growth-oriented stocks and the emerging artificial intelligence industry.
Credit Market Recap – Bonds Trade Lower as Interest Rates Rise
Rising interest rates were a significant headwind for bonds during the third quarter. Figure 4, which graphs the quarterly total return of the Bloomberg U.S. Bond Aggregate Index, puts the losses in perspective. The chart shows the Bond Aggregate Index, which tracks a wide array of Treasury, corporate, and municipal bonds, generated a total return of -3.2% during the third quarter and pushed the year-to-date return into the red. The negative total return indicates the decline in bond prices have more than offset the interest received this year. This is on the heels of the worst year in history for bond markets last year, when this returned -13% (our Canadian equivalent returned -11.7%)

The yellow line in Figure 4 shows bonds haven't experienced a sequence of negative returns like the current trend since the 1970s, which was the last time the Fed aggressively raised interest rates to combat inflation. Factoring in the third quarter sell-off, four of the 10 worst quarters for the Bond Aggregate Index have occurred since the start of 2022. While savers are earning significantly more interest compared to the last decade, the higher interest income is being offset by falling bond prices. Investors need to be careful on what many have deemed a ‘conservative’ portfolio for a long time, as the secular bull market in bonds that lasted the better part of three decades ended in 2020.
Elsewhere across the bond market, riskier bonds continued to outperform higher-quality bonds during the third quarter. U.S. High-yield corporate bonds produced a total return of -0.3%, while investment-grade corporate bonds generated a -4.6% total return. The performance gap can be attributed to two factors. First, high-yield bonds typically have shorter maturities than investment-grade bonds. As a result, rising interest rates had less of an effect on high-yield bonds during the third quarter. Second, high-yield bonds offer a higher yield than investment-grade bonds to compensate for their increased credit risk. This higher yield boosted high-yield’s total return and offset a portion of capital losses.
Fourth Quarter Outlook – What to Watch?
After an extremely challenging 2022, it’s been a better year for investors. Entering the fourth quarter, the S&P 500’s year-to-date return has already surpassed the average return for a full calendar year, while Canada lags. However, outside of isolated strong returns in the two equity sectors in Canada and three in the U.S., returns have been difficult to come by.
Several factors will influence how the market finishes this year, including the paths of oil prices and interest rates. Corporate earnings and economic data will also be at the top of many investors’ watchlists. The third-quarter earnings season starts in mid-October, and it will provide key insights into consumer spending and the effect of higher interest rates. On the economic front, investors will be focused on the labor market, the trajectory of inflation, and third-quarter GDP growth, which will be released in late October.
We will be monitoring corporate earnings and economic trends throughout the fourth quarter to help guide portfolio positioning. In addition, our Milestone Recession Risk composite will guide our top-down risk management. The market is entering the final stretch of 2023, but there are still a lot of important data points to be released and questions to be answered before we turn the calendar to 2024. Our team will continue to remain vigilant towards economic and market risks, monitoring conditions as they evolve and will be prepared to adapt portfolios if needed as the rest of 2023 plays out.
Thank you for your continued trust in Milestone and for the opportunity to assist you in working toward your financial goals. We understand the risks facing both the markets and the economy, and we are committed to helping you effectively navigate this challenging investment environment. Successful investing is a marathon, not a sprint, and even intense volatility is unlikely to alter a diversified approach set up to meet your long-term investment goals. Therefore, it’s critical to stay invested, remain patient, and stick to the plan, as we’ve worked with you to establish a unique, personal allocation target based on your financial position, risk tolerance, and investment timeline.
Here is our quarterly Milestone Market Report on economic data, capital markets, commodities, and currencies through September 30th, 2023:

Disclosure:
Investing in equities is not guaranteed, values change frequently, and past performance is not necessarily an indicator of future performance. Investors cannot invest directly in an index. Index returns do not reflect any fees, expenses, or sales charges. Opinions and estimates are written as of the date of this report and may change without notice. Any commentaries, reports or other content are provided for your information only and are not considered investment advice. Readers should not act on this information without first consulting Milestone, their investment advisor, tax advisor, financial planner, or lawyer. This communication is intended for Canadian residents only and does not constitute as an offer or solicitation by anyone in any jurisdiction in which such an offer is not allowed.
Sources: Thomson Reuters, BNN Bloomberg, Refinitiv, TD Asset Management, Teranet and National Bank of Canada, MarketDesk Research LLC, Federal Reserve, U.S. Treasury, Freddie Mac, National Association of Realtors
©2023 Milestone Wealth Management Ltd. All rights reserved.