Market Insights: S&P/TSX Composite Index vs. S&P 500 Index
Milestone Wealth Management Ltd. - Aug 25, 2023
Macroeconomic and Market Developments:
- North American markets were mixed this week. In Canada, the S&P/TSX Composite Index increased slightly by 0.09%. In the U.S., the Dow Jones Industrial Average decreased 0.45% and the S&P 500 Index rose 0.82%.
- The Canadian dollar devalued this week, closing at 73.50 vs 73.80 USD cents last Friday.
- Oil prices were negative this week. U.S. West Texas crude closed at US$80.05 vs US$81.38, and the Western Canadian Select price closed at US$60.52 vs US$63.38 last Friday.
- The price of gold was positive this week, closing at US$1,913 vs US$1,889 last Friday.
- U.S. bond yields have been on the rise lately, with the 10-year treasury note hitting its highest level since 2007. After pulling back to 3.29% on April 4th of this year, yields have climbed steadily, hitting a new closing high of 4.32% on Monday of this week, eclipsing the high of 4.22% from October 2022. The 10-year yield pulled back slightly to finish the week at 4.23%.
- Permian Resources (PR) is acquiring Earthstone Energy (ESTE) in an all-stock transaction valued at approximately $4.5 billion, inclusive of Earthstone’s net debt. The transaction adds significant high-quality acreage to add to Permian’s existing core acreage in New Mexico and will be highly accretive to operating cash flow.
- Canadian retail sales in June rose by more than expected, increasing by 0.4%, according to an advance estimate from Statistics Canada. The report shows Canadians continued to spend on big-ticket items like cars, while spending on other products such as clothing and furniture contracted in June.
- All eyes were on Nvidia (NVDA) this week as the company released earnings after the market closed on Wednesday. The chip maker has been a leader in the emergence of the AI craze and they didn’t disappoint. Quarterly earnings were $2.70/share vs $2.09/share expected, on revenue of $13.51 billion vs $11.22 billion expected. To add to the positive tone, the company said it expects third-quarter revenue of about $16 billion, suggesting revenue will grow 170% from the previous year.
- Canadian bank earnings kicked off this week with TD Bank (TD) and Royal Bank (RY) reporting on Thursday. Royal Bank beat expectations with earnings of $2.84/share vs $2.70/share expected, on revenue of $14.49 billion vs $12.82 billion expected. However, expenses climbed 23% and as a result, the bank plans to cut as much as 2% of its full-time staff in the coming quarter. TD Bank missed earnings estimates with $1.99/share vs $2.04 predicted, despite revenue coming in at $13.01 billion vs $12.11 billion predicted.
- Private equity firm Roark Capital is buying Subway for an undisclosed amount, ending the sandwich chain’s more than five decades of family ownership. Through its holding companies, Roark currently owns brands like Dunkin’ Donuts, Baskin-Robbins, Arby’s, Cinnabon and Buffalo Wild Wings.
Weekly Diversion:
Check out this video of a mother’s heartwarming story.
Charts of the Week:
As of market close, the S&P/TSX Composite is currently up 2.02% YTD compared to the S&P 500 being up 15.21% YTD on a price return basis. In this week’s Charts of the Week, we explore the main sectors that make up these indices which help explain the lower performance in Canada. The U.S. has three main stock indexes; however, we chose to compare the TSX to the S&P 500 as it represents 500 of the largest companies in the U.S. vs the Dow Jones representing just 30 blue-chip companies and the NASDAQ focusing heavily on the technology sector.
As we can see in the charts below, the composition of the TSX is heavily dominated by Financials at 30.9%, followed by Energy at 16.9%, Industrials at 13.5%, Materials 12.1%, and Information Technology at 7.8%. Contrast this with the S&P 500 that is heavily weighted towards Information Technology at 28.1% followed by Heath Care at 13.1%, Financials at 12.6%, Consumer Discretionary at 10.6%, and Communication Services at 8.7%.
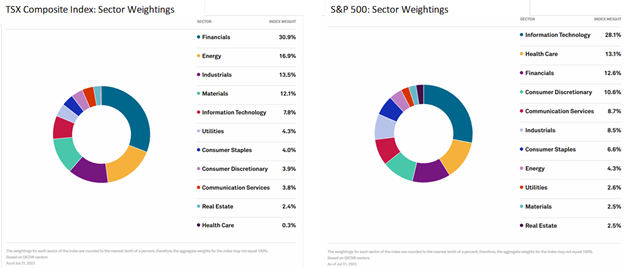
Source: S&P Global
The charts below from earlier today highlight the performance of the S&P/TSX Composite Index and the S&P 500 Index as well as the performance of the underlying sectors. As we can see, the top performers year-to-date for the TSX are Information Technology at 32.55%, Health Care at 18.33%, and Industrials at 6.71% while Communication Services at -9.64%, Utilities at -2.41%, and Financials at -1.65%, lead the laggards for the index. For the S&P 500, in contrast to the TSX, Communication Services lead at 37.27% as the top performing sector, followed by Information Technology at 36.88% and Consumer Discretionary at 28.24%, while Utilities at -10.00%, Consumer Staples at -2.42%, and Health Care at -2.00% lead the lagging sectors. This illustrates that the TSX’s heavy weighing towards Financials has hampered returns YTD with the Canadian banking industry being largely affected by interest rate uncertainty and rising loan loss provisions. In fact, if you remove the Canadian tech sector, the TSX Composite is essentially flat on a price return basis. In contrast, the S&P 500 has benefited greatly from the strong performance of the Information Technology Sector at just under 30% of index weight. Keep in mind, this sector is very volatile, recovering from being down about 30% in 2022.
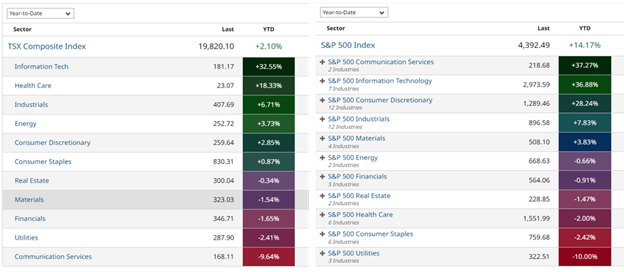
Source: barchart.com
The performance of different sectors within these indices shows the importance of diversifying a portfolio, not only by sector, but also by country. We have always stressed this importance and avoided over-weighting our portfolios too heavily to specific sectors, as market sentiment changes quickly.
Sources: CNBC.com, Globe and Mail, Financial Post, Bloomberg, Thomson Reuters, Refinitiv, Wealth Professional, Seeking Alpha, Business Insider, barchart, S&P Global
©2023 Milestone Wealth Management Ltd. All rights reserved.
DISCLAIMER: Investing in equities is not guaranteed, values change frequently, and past performance is not necessarily an indicator of future performance. Investors cannot invest directly in an index. Index returns do not reflect any fees, expenses, or sales charges. Opinions and estimates are written as of the date of this report and may change without notice. Any commentaries, reports or other content are provided for your information only and are not considered investment advice. Readers should not act on this information without first consulting Milestone, their investment advisor, tax advisor, financial planner or lawyer. This communication is intended for Canadian residents only and does not constitute as an offer or solicitation by anyone in any jurisdiction in which such an offer is not allowed.