Market Insights: Seasonal Weakness Right on Cue
Milestone Wealth Management Ltd. - Aug 18, 2023
Macroeconomic and Market Developments:
- North American markets were down this week. In Canada, the S&P/TSX Composite Index declined 2.89%. In the U.S., the Dow Jones Industrial Average dropped 2.21% and the S&P 500 Index fell 2.11%.
- The Canadian dollar fell over the past two weeks since our last update, closing at 73.80 cents vs 74.74 USD cents two weeks ago.
- Oil prices were negative over the past two weeks. U.S. West Texas crude closed at US$81.38 vs US$82.65, and the Western Canadian Select price closed at US$63.38 vs US$67.28 two weeks back.
- The price of gold was lower over the past two weeks, closing at US$1,889 vs US$1,942.
- The markets pulled back this week, in part due to worries about the Chinese economy. On Thursday, China Evergrande, the world's most indebted property developer with around $300 billion in liabilities, filed for protection under Chapter 15 of the U.S. bankruptcy code. Another Chinese developer, Country Garden, has also been in the spotlight after missing dollar-denominated debt payments, increasing worries about the property sector.
- Canada’s inflation rate rose slightly, with the Consumer Price Index (CPI) coming in at 3.3% from July 2022 to July 2023. This reading was slightly above the forecast of 3.0% and up from 2.8% last month. Statistics Canada says the rise in inflation for July is due to gasoline prices that fell less dramatically from prices a year ago.
- Suncor Energy (SU) reported better than expected earnings of $0.96/share vs the expected $0.93/share, with cash flow of $2.14/share vs $2.12/share expected. Production came in above expectations at 741.9Mboe/d vs 731.8Mboe/d forecasted.
- Shawcor (MATR) has signed a deal to sell a substantial part of its pipe coating division to Tenaris S.A. for about $220 million. The sale includes operations in Canada, the U.S., Mexico, Norway, the UAE and Indonesia, several mobile concrete coating plants, its joint-venture interest in Azerbaijan, research and development operations in Toronto and Norway, and intellectual property.
- U.S. retailers were in focus this week with earnings announcements giving some indication as to how the consumer is reacting to higher interest rates. On Tuesday, Home Depot (HD) beat estimates with earnings of $4.65/share vs $4.45/share expected. On Wednesday, Target (TGT) also beat estimates with $1.80/share in earnings vs $1.39/share expected, however it came in low on revenue with $24.77 billion vs $25.16 billion forecast and cut its full-year sales and profit forecast. And on Thursday, Walmart (WMT) released earnings of $1.84/share vs $1.71/share expected on revenue of $161.63 billion vs $160.27 billion expected and raised its forecast for the rest of the fiscal year.
- Popular grocery delivery company Instacart is planning an initial public offering (IPO) as soon as September. The company has slashed its internal valuation to around $10 billion, down 20% from the value it had estimated in October and more than 75% lower than its valuation in 2021.
Weekly Diversion:
Check out this video of a dolphin playing with a dog
Charts of the Week:
August has gotten off to a bad start for markets with the S&P 500 Index down 4.78% as of today’s market close. However, we wanted to point out in this week’s charts section that this appears to be a common trend for the S&P 500 and may point to future optimism for the index in the near future due to the strong first half.
The following chart illustrates the performance of the S&P 500 by month from 1950 to 2022 and groups the performances by different time periods including: Since 1950, The Past 20 Years, The Past 10 Years, and Pre-Election Years. As we can see, August and September have typically not been favourable months for the index regardless of the time periods being observed, with September being the worst month historically for the S&P 500.
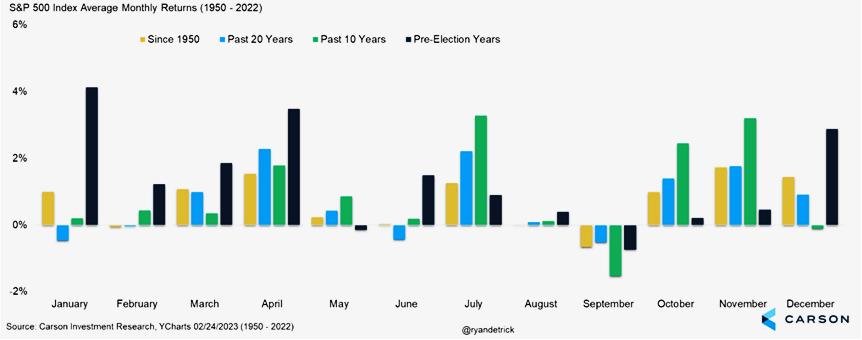
Source: Carson Investment Research
As we can see in the next chart, 2023 is closely following similar years of strong market performance up to July 31st, with lackluster performance in August and September which is reinforced by the data from the previous chart above. This chart shows the year-to-date performance of the S&P 500 for 2023 in green and the average performance of the S&P 500 since 1950 in years where the S&P 500 was up 10% or more at the end of June like this year - with 21 prior occurrences, we have a lot of comparable data to use. The highlighted yellow section shows the average performance for these years for the months of August, September, and October trading sideways to down, only to then lead into a year-end positive move. During those years since 1950 when the S&P 500 was up 10% or more at the end of June, the annual performance averaged an impressive 24.94% for the full year.
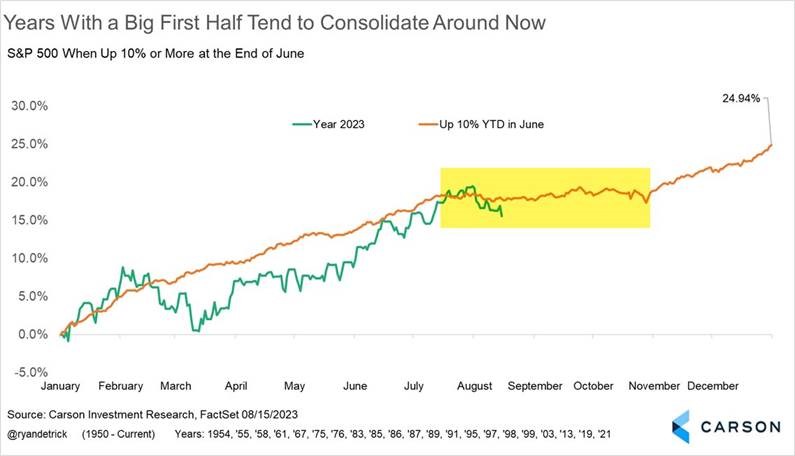
Source: Carson Investment Research via The Chart Report
With weaker performances in August and September in general, one may question why we continue to remain invested during these periods. The answer of course is that no investor can predict the future and know with certainty what will happen during the short-term. Having said that, Milestone did raise cash at the end of July in our core mandates in reaction to what has been a very nice uptrend in the markets and with the anticipation of a potential pullback during the seasonably weaker months. So whereas we know that no one can ‘time the markets’ and that time in the markets over the long-term is critical, we do try to observe historical trends to our clients’ advantage.
Sources: CNBC.com, Globe and Mail, Financial Post, Bloomberg, Thomson Reuters, Refinitiv, Wealth Professional, Seeking Alpha, Business Insider, Carson Investment Research, The Chart Report.
©2023 Milestone Wealth Management Ltd. All rights reserved.
DISCLAIMER: Investing in equities is not guaranteed, values change frequently, and past performance is not necessarily an indicator of future performance. Investors cannot invest directly in an index. Index returns do not reflect any fees, expenses, or sales charges. Opinions and estimates are written as of the date of this report and may change without notice. Any commentaries, reports or other content are provided for your information only and are not considered investment advice. Readers should not act on this information without first consulting Milestone, their investment advisor, tax advisor, financial planner or lawyer. This communication is intended for Canadian residents only and does not constitute as an offer or solicitation by anyone in any jurisdiction in which such an offer is not allowed.