Market Insights: Two Major Types of Bear Markets
Milestone Wealth Management Ltd. - Aug 04, 2023
Macroeconomic and Market Developments:
- North American markets were lower this week. In Canada, the S&P/TSX Composite Index was down 1.41%. In the U.S., the Dow Jones Industrial Average declined 1.11% and the S&P 500 Index fell 2.27%.
- The Canadian dollar also pulled back this week, closing at 74.74 cents vs 75.54 cents USD last Friday.
- Oil prices gained for the sixth straight week. U.S. West Texas crude closed at US$82.65 vs US$80.61 last Friday, and the Western Canadian Select price closed at US$67.28 vs US$65.02 last Friday.
- The price of gold was down this week, closing at US$1,942 vs US$1,958 last Friday.
- Pipestone Energy (PIPE) is being acquired by private company Strathcona Resources, with the new publicly traded entity taking on the Strathcona name and creating Canada's fifth largest oil company. The deal values the new company’s market cap at approximately $8.6 billion, or approximately $11.5 billion in total enterprise value when taking debt into consideration.
- National Bank of Canada (NA) says it will acquire the Canadian branch of Silicon Valley Bank’s commercial loan portfolio. The portfolio is made up of about $1 billion in loan commitments, of which $325 million are outstanding with much of the portfolio focused on the technology, life science and global fund banking sectors. Silicon Valley Bank, a U.S. financial firm favoured by startups, failed earlier this year when its clients rushed to withdraw billions of dollars as they feared for the organization's solvency.
- The Canadian Manufacturing PMI (Purchasing Managers Index) came in at 49.6 for July (a reading below 50 indicates contraction). This was a slight improvement from 48.8 in June but is the third straight month in contraction territory. In the U.S., the ISM Non-Manufacturing (Services) PMI declined to 52.7 in July, below the expected 53.1 but still above the 50 level indicating growth.
- In a surprise move, debt rating agency Fitch Ratings cut its rating on the United States’ long-term debt to AA+ from AAA. In the release, the agency said “the repeated debt-limit political standoffs and last-minute resolutions have eroded confidence in fiscal management”.
- Canadian Natural Resources (CNQ) reported better than expected quarterly adjusted funds flow of $2.48/share vs the $2.44/share expected. Adjusted earnings also beat expectations with $1.14/share vs $1.09/share forecast and production came in at 1,194.3 MBoe/d vs 1,195.2MBoe/d forecast.
- After the market closed on Thursday, Apple (AAPL) and Amazon (AMZN) released much-anticipated earnings. Apple reported a slight beat, with earnings of $1.26/share vs $1.19/share expected on $81.80 billion in revenue vs $81.69 billion expected. The all-important iPhone revenue component came in a bit light at $39.67 billion vs $39.91 billion estimated, down 2% year-over-year. Amazon reported blowout earnings of $0.65/share vs $0.35/share forecast on $134.4 billion revenue vs $131.5 billion forecast. Amazon’s stock price got a lift as a result, rising 8.27% on Friday.
- Employment numbers for July were released on Friday. In Canada, the economy lost 6,400 jobs, well below the 25,000 gain expected, with the unemployment rate increasing by 0.1% to 5.5%. In the United States, nonfarm payrolls showed a gain of 187,000 jobs, slightly below expectations for a 200,000 gain, but the unemployment rate surprisingly dropped by 0.1% to 3.5%.
Weekly Diversion:
Check out this video: The Most Creative Proposal Ever
Charts of the Week:
This week we wanted to review the differences between the two major types of bear markets: recessionary bear markets and non-recessionary bear markets. A bear market is defined by a prolonged drop in investment prices – generally, a bear market occurs when a broad market index falls by 20% or more from its most recent high. Simply put, a recessionary bear market occurs in and around an economic recession while a non-recessionary bear does not. The key difference between the two is the presence of an official recession or a period of two consecutive quarters of negative gross domestic product (GDP). Now, let’s explore some past examples of both.
As the following table shows, there have been 14 prior instances of recessionary bear markets in the U.S. going back to 1929. We can see that these bear markets tend to be more severe with an average decline in the S&P 500 of 39.4%. They also tend to be more prolonged, with the length of time spent in the bear market lasting an average of 390 days. Recessionary bear markets are also often associated with extremely difficult economic situations. Some examples of these are the Great Depression, the 2008-9 Global Financial Crisis, and most recently, the Covid-19 Pandemic.
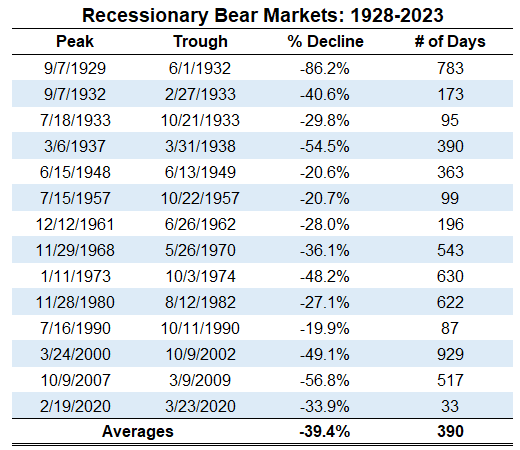
Source: A Wealth of Common Sense
In the next table, we can observe a list of past non-recessionary bear markets which includes 11 instances since 1934. With non-recessionary conditions, bear markets tend to be less severe with an average drawdown in the S&P 500 of 25.9%, while the duration is also less pronounced with the average lasting 210 days. This is an important distinction to make when we observe what happened in 2022. Many economists were predicting a recession, inflation was running rampant, and a general sense of elevated fear dominated news headlines. However, the decline of 25.4% fell almost exactly in line with the non-recessionary bear market average of 25.9%, and the duration of 282 days was longer than the average number of 210 days but still much shorter than the average recessionary bear market. Interestingly, 2022 represented the third longest occurrence but just the sixth most severe drawdown out of the 11 total occurrences. That is not to say that a recession isn’t forthcoming coming at some point, but with 2022 in the rear-view mirror, there is now more evidence that this may have been a textbook non-recessionary bear market.
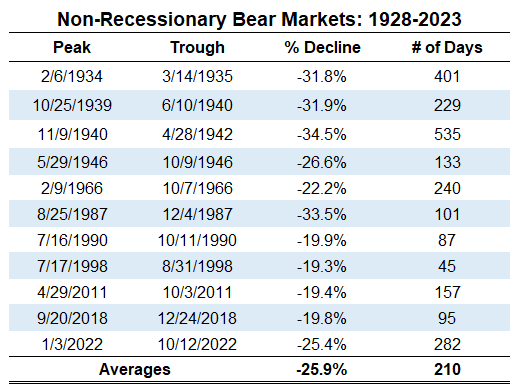
Source: A Wealth of Common Sense
The last table below summarizes the differences between these two types of bear markets with regards to number of occurrences, average drawdown, and average days peak-to-trough.
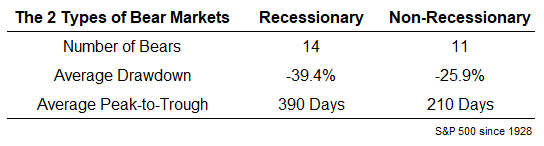
Source: A Wealth of Common Sense
Sources: CNBC.com, Globe and Mail, Financial Post, Bloomberg, Thomson Reuters, Refinitiv, Wealth Professional, Business Insider, A Wealth of Common Sense
©2023 Milestone Wealth Management Ltd. All rights reserved.
DISCLAIMER: Investing in equities is not guaranteed, values change frequently, and past performance is not necessarily an indicator of future performance. Investors cannot invest directly in an index. Index returns do not reflect any fees, expenses, or sales charges. Opinions and estimates are written as of the date of this report and may change without notice. Any commentaries, reports or other content are provided for your information only and are not considered investment advice. Readers should not act on this information without first consulting Milestone, their investment advisor, tax advisor, financial planner or lawyer. This communication is intended for Canadian residents only and does not constitute as an offer or solicitation by anyone in any jurisdiction in which such an offer is not allowed.