Market Insights: CPI vs. PPI Spread
Milestone Wealth Management Ltd. - Jul 21, 2023
Macroeconomic and Market Developments:
- North American markets were positive this week. In Canada, the S&P/TSX Composite Index was up 1.41%. In the U.S., the Dow Jones Industrial Average increased 2.08% and the S&P 500 Index rose 0.69%.
- The Canadian dollar decreased slightly this week, closing at 75.63 cents vs 75.66 cents last Friday.
- Oil prices were mixed this week. U.S. West Texas crude closed at US$76.94 vs US$75.42 last Friday, and the Western Canadian Select price closed at US$62.92 vs US$63.40 last Friday.
- The price of gold rallied this week, closing at US$1,961 vs US$1,955 last Friday.
- PolyMet Mining (POM) has reached an agreement to be acquired by Glencore AG. The Swiss commodity trading company will purchase the ~17.8% of the company that it does not already own for $2.11/share in cash, with the deal expected to close at the end of the third quarter of 2023.
- After the close on Wednesday, Tesla (TSLA) reported earnings of $0.91/share on revenue of $24.93 billion. The stock price reacted negatively, dropping by 9.74% on the day, although the stock is still up over 140% so far in 2023.
- Also on Wednesday, Netflix (NFLX) reported earnings of $3.29/share on $8.20 billion of revenue. The streaming giant said it added 5.9 million customers during the second quarter amid its broader crackdown on password sharing in the United States. Netflix’s stock price dropped 8.41% on Thursday, but that still leaves the stock up over 44% year to date.
- Canada’s inflation cooled once again in June, with the Consumer Price Index (CPI) coming in at 2.8% year over year, down from 3.4% in the May 2022 to May 2023 period, and below the 3.0% level economists had been predicting.
- Canadian tech company Constellation Software (CSU) has signed a deal to acquire Optimal Blue, a business division of Black Knight Inc., for a total of US$700 million. Optimal Blue offers software and data services specifically tailored for the mortgage industry. This acquisition follows Constellation's previous agreement to acquire Black Knight's Empower loan origination system business.
- American Express (AXP) reported record earnings of $2.89/share, above the $2.81/share expected. However, revenue came in slightly below expectations at $15.05 billion vs $15.48 billion that had been forecast, leading to weakness in the stock price on Friday.
Weekly Diversion:
Check out this video: Golden Retriever Reaction to a Tiny Kitten Occupying her Bed
Charts of the Week:
Over the past two weeks, Canada and the U.S. announced inflation data that offered some relief for consumers with the U.S. year-over-year headline Consumer Price Index (CPI) rate for June coming in at 3.0% and the Canadian rate coming in at 2.8%, both under most analysts’ expectations. In today’s Charts of the Week, we are going to observe some of the relationships between two of the leading indicators of inflation: the CPI and the Producer Price Index (PPI), and the affect these indicators have on the S&P 500.
The CPI tracks how much the average household spends on a set basket of goods, and how those prices change over time. The PPI is a monthly measure of the rate of change in prices paid to U.S. producers of goods and services. It's used in business and government as a measure of wholesale inflation and is seen as a leading indicator of increases in consumer prices. The CPI is a measure of costs for consumers whereas PPI is a measure of wholesale costs.
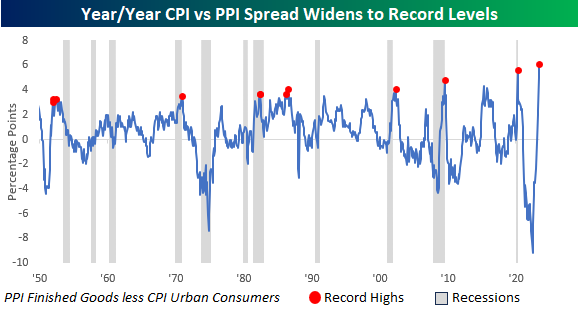
There are a few different versions of PPI that exist, but for this review, we are going to focus on PPI-Finished Goods as it provides the longest history. In the chart below, we can see the comparison between CPI and PPI going back to the late 1940s and this gap is currently sitting at a record 6.1 percentage points (CPI higher than PPI).

Source: Bespoke Investment Group
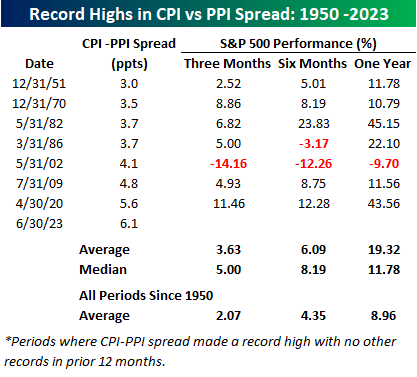
The current record spread indicates that corporate profit margins remain strong, and as earnings continue to be reported (short of a few underperformers), this theory has been reinforced. When observing past periods where there were wide margins between consumer and producer prices, forward returns in the S&P 500 were very strong. The table below lists each time the spread between CPI and PPI-Finished Goods widened to a record high (with no occurrences in the prior 12 months), and for each period we list the S&P 500’s performance over the following three, six, and twelve months. Three months after the seven prior periods, the S&P 500’s average change was a gain of 3.63% vs. the average of all periods since 1950 of 2.07% with gains six of seven times. Six and twelve months later, the S&P 500’s average was a gain of 6.09% (5 of 7 years were positive) and 19.32% (6 of 7 years were positive) vs. the average for all periods of 4.35% and 8.96%, respectively. As the table shows, for each observed period, forward returns were well ahead of the long-term average.
Source: Bespoke Investment Group
With all the talk about a potential recession and soft vs. hard landings, it’s interesting to observe these record spreads between CPI/PPI and prior recessions. The following chart (same chart as above, with recession periods represented by the grey bars) illustrates that all but two of these record spreads came late in a recession or in the early months of an economic expansion. Time will tell if this trend continues, and we see recessionary indicators fade.
Source: Bespoke Investment Group
Sources: CNBC.com, Globe and Mail, Financial Post, Bloomberg, Thomson Reuters, Refinitiv, The Chart Report, StockCharts.com, Stats Canada, Bureau of Labor Statistics, Bespoke Investment Group
©2023 Milestone Wealth Management Ltd. All rights reserved.
DISCLAIMER: Investing in equities is not guaranteed, values change frequently, and past performance is not necessarily an indicator of future performance. Investors cannot invest directly in an index. Index returns do not reflect any fees, expenses, or sales charges. Opinions and estimates are written as of the date of this report and may change without notice. Any commentaries, reports or other content are provided for your information only and are not considered investment advice. Readers should not act on this information without first consulting Milestone, their investment advisor, tax advisor, financial planner or lawyer. This communication is intended for Canadian residents only and does not constitute as an offer or solicitation by anyone in any jurisdiction in which such an offer is not allowed.