Market Insights: U.S. Returns Relative to History
Milestone Wealth Management Ltd. - Jul 07, 2023
Macroeconomic and Market Developments:
- North American markets were lower this week. In Canada, the S&P/TSX Composite Index was down 1.61%. In the U.S., the Dow Jones Industrial Average fell 1.96% and the S&P 500 Index dropped 1.16%.
- The Canadian dollar dropped slightly this week, closing at 75.34 cents vs 75.52 cents last Friday.
- Oil prices were higher this week. U.S. West Texas crude closed at US$73.86 vs US$70.64 last Friday, and the Western Canadian Select price closed at US$62.37 vs US$59.34 last Friday.
- The price of gold also improved this week, closing at US$1,925 vs US$1,919 last Friday.
- Canada’s economy is still in growth mode, with GDP increasing by 0.4% in May following a flat reading in April, the weak reading in part due to the federal workers’ strike. Even if June’s GDP comes in flat, the Canadian economy is now on track to expand at a 1.4% annualized rate in the second quarter, staving off the much predicted recession.
- The strike at British Columbia ports was big news this week, as more than 7,000 workers who load and unload cargo at more than 30 B.C. ports went on strike last Saturday morning. Concern grew among economists and politicians throughout the week regarding the effect on the Canadian economy if the strike continues, with the ports of Vancouver and Prince Rupert handling almost 20% of Canada’s traded goods.
- Tesla (TSLA) set a new record for vehicles delivered at 466,140 in the second quarter, well above estimates of around 445,000 units and up from 422,875 in Q1. The company produced 479,700 vehicles during the second quarter, up from 440,808 in the first quarter.
- Canada’s manufacturing sector slowed slightly in June, with the S&P Global Canada Manufacturing PMI (Purchasing Managers Index) falling to 48.8 in June from 49.0 in May (a score below 50 indicates contraction). In the U.S., the ISM's manufacturing PMI dropped to 46.0 last month, the lowest reading since May 2020, from 46.9 in May. That marked the eighth straight month that the PMI stayed below the 50 threshold. On the flipside, the service sector continues to be strong, with the U.S. ISM Non-Manufacturing (Services) index increasing to 53.9 in June, beating the expected 51.2 and well above the 50 level indicating growth.
- On Wednesday, Meta Platforms (META), parent company of Facebook and Instagram, launched Threads, its short-posting text app as a direct competitor to Twitter. As with Twitter, users can post short text, links, pictures and videos, as well as repost messages from others and reply to items. Threads subscribers can additionally use their existing Instagram usernames to bring over information, including lists of followers.
- Employment numbers for June were released on Friday. In Canada, our economy added 60,000 jobs, well above the 20,000 estimate, however the unemployment rate actually rose from 5.2% last month to 5.4% due to an increase in the labour force. In the U.S., nonfarm payrolls increased 209,000, below the 240,000 estimate, and the unemployment rate came in at 3.6%, down from 3.7% last month.
Weekly Diversion:
Check out this video: Beluga whale playing fetch
Charts of the Week:
The S&P 500 Index has had a tremendous first half of 2023, closing up 16.9% on a total return basis, leaving many investors questioning if this momentum can be maintained. We should note, however, this is on the heels of being down 18.1% in 2022, so some context is needed. It is also noteworthy that the equal-weighted S&P 500 is up 10% less, so these returns have been isolated mostly to the information technology and communication services sectors. Short-term market moves are important to be aware of and should always be considered, but more important for investors is to understand long-term trends.
The chart below compares the annualized total return of the S&P 500 over the last one, two, five, ten, and twenty years and how each one stacks up relative to all other periods throughout the index's history. For the last 12 months through June, the S&P 500’s total return of 19.6% is just shy of 8% above its full history one-year average. As shown in the lower chart, that performance ranked just below the 67th percentile relative to all other 12-month periods in the S&P 500’s history. This is likely contrary to what most economists and forecasters had predicted at the beginning of this year.
Taking a longer-term perspective, however, the S&P 500’s returns look a lot less extreme, and in some cases such as the two-year average, very poor. With an annualized gain of just 3.4%, the S&P 500’s performance is more than seven percentage points less than the historical two-year average and ranks in just the 22nd percentile relative to all other two-year periods. In other words, as extreme as the last year has been in terms of better-than-average performance, the last two years have been just as extreme in terms of underperformance. Talk about a roller coaster.
Looking further out over the last five and ten years, the S&P 500’s annualized returns are about two percentage points above their long-term averages, which rank in the 55th and 58th percentiles respectively. Two percentage points over a period of five or ten years add up and is nothing to dismiss, but over the last 20 years, the S&P 500‘s 10% annualized performance is just under a full percentage point below the historical average of 10.9% and ranks in the 42nd percentile relative to all other 20-year periods since 1929.
It is easy to look at this year’s returns for the U.S. and say the market has gotten ahead of itself, but it’s just as easy to look over a different time period and say that it has fallen behind. It all depends on your timeframe.

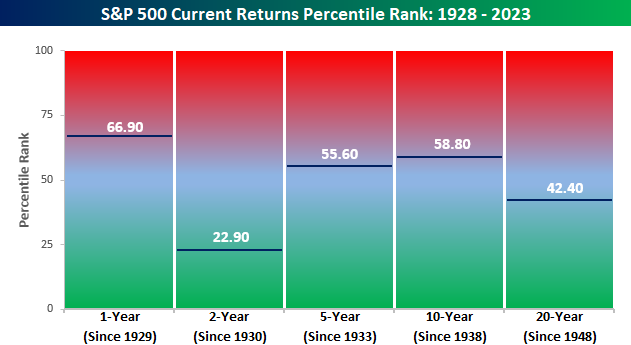
Source: Bespoke Investment Group
Sources: CNBC.com, Globe and Mail, Financial Post, BNN Bloomberg, Thomson Reuters, Refinitiv, Business Insider, Bespoke Investment Group
©2023 Milestone Wealth Management Ltd. All rights reserved.
DISCLAIMER: Investing in equities is not guaranteed, values change frequently, and past performance is not necessarily an indicator of future performance. Investors cannot invest directly in an index. Index returns do not reflect any fees, expenses, or sales charges. Opinions and estimates are written as of the date of this report and may change without notice. Any commentaries, reports or other content are provided for your information only and are not considered investment advice. Readers should not act on this information without first consulting Milestone, their investment advisor, tax advisor, financial planner or lawyer. This communication is intended for Canadian residents only and does not constitute as an offer or solicitation by anyone in any jurisdiction in which such an offer is not allowed.