Market Insights: June Seasonality and Election Years
Milestone Wealth Management Ltd. - Jun 02, 2023
Before kicking off this week's market developments and our Charts of the Week, we wanted to inform our readers that Shawn Boos will be participating in this year’s MS Bike event from Airdrie to Olds on June 24th and 25th. Here is a link to Shawn’s personal fundraising page if you’d like to support MS Canada and this important cause: Shawn’s MS Bike Page
Macroeconomic and Market Developments:
- North American markets were positive this week. In Canada, the S&P/TSX Composite Index increased 0.52%. In the U.S., the Dow Jones Industrial Average jumped 2.02% and the S&P 500 Index rose 1.83%.
- The Canadian dollar rallied this week, closing at 74.46 cents vs 73.45 cents last Friday.
- Oil prices were down this week. U.S. West Texas crude closed at US$71.95 vs US$72.79 last Friday, and the Western Canadian Select price closed at US$48.85 vs US$51.42 last Friday.
- The price of gold improved slightly this week, closing at US$1,948 vs US$1,947 last Friday.
- The U.S. managed to stave off hitting the debt ceiling when a deal was reached last weekend between President Biden and House Speaker Kevin McCarthy, extending out the ceiling to 2025. The House passed the debt ceiling bill Wednesday night, with the Senate passing the bill on Thursday.
- The Canadian economy grew at an annualized rate of 3.1% in the first quarter of 2023, higher than Statistics Canada’s own forecast of 2.5% for the quarter. A preliminary estimate suggests the economy grew by 0.2% in April, after remaining flat in March.
- ConocoPhillips (COP) exercised its right to acquire TotalEnergies SE’s 50% stake in the Surmont oil-sands field for as much as $3.33 billion, giving it full control of the Canadian operation and thwarting efforts by Suncor to buy into the site. The purchase includes a $3 billion price tag and as much as $325 million in contingent payments.
- Pembina Pipeline (PPL) has entered into an agreement with Marubeni Corporation to progress an end-to-end, low-carbon ammonia supply chain from Western Canada to Japan and other Asian markets. The project includes the joint development of a world-scale, low-carbon hydrogen and ammonia production facility to be sited on Pembina-owned lands adjacent to its Redwater Complex near Fort Saskatchewan.
- Great-West Lifeco (GWO) has agreed to sell Putnam Investments to Franklin Templeton. The total potential transaction consideration and retained value is estimated to be $1.7 - $1.8 billion and the transaction is expected to close in Q4 of 2023.
- Employment data was released in the U.S. for May, coming in much better than anticipated. Non-farm payrolls in May increased by 339,000, better than the 190,000 Dow Jones estimate, however, the unemployment rate rose to 3.7% from 3.4% in May against the estimate for 3.5%, the highest level since October 2022. The reason for the growth in unemployment, even though non-farm payrolls increased, is that civilian employment - an alternative measure of job growth that includes small business start-ups - declined 310,000 in May. This big decline in civilian employment, paired with a 130,000 person increase in the labor force, resulted in the unemployment rate rising to 3.7% in May.
Weekly Diversion:
Check out this video: Raccoon 'pool party' caught on video
Charts of the Week:
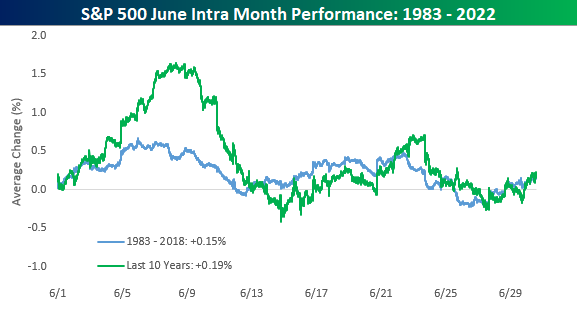
June has historically been a month with multiple fluctuations that result in marginal gains for the S&P 500 Index when compared to high performing months such as November, December, and April. However, there are certain factors that can help improve the outlook for the month and raise optimism for stronger returns.
The chart below illustrates the intra-month performance of the S&P 500 for June from 1983 to 2022. The first few days of the month tend to start off strong, but the second week of June has typically been met with heavy selling. By the end of the second week of June, the S&P 500 tends to find itself right back where it started, before leveling off. Heading into the final few days of June, the S&P 500 once again finds its footing at the unchanged level before finishing off the month with a slight positive bias. Since 1983, June has averaged a gain of 0.15% with positive returns 63% of the time while the average June performance over the last ten years has been a gain of 0.19% with gains 70% of the time.

Source: Bespoke Investment Group
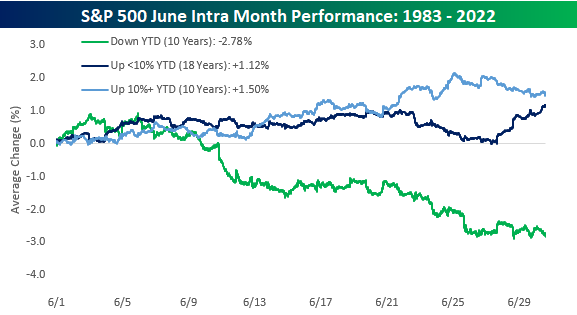
The first factor that can influence the monthly performance is market momentum. The following chart shows that the average performance for June looks brighter when entering the month with positive momentum. Since 1983, there have been 10 years where the S&P 500 was down year-to-date (YTD) heading into June. In those years, the S&P 500 tended to start off fine but began to weaken dramatically in the second half of the month finishing near the lows. By the end of June, the S&P 500 was down an average of 2.78% with gains just three out of ten times. However, when the S&P 500 has been higher YTD through the end of May (like this year), June tends to be a much stronger month. In the 18 years where the S&P 500 was up less than 10% as of the end of May (this year), it finished the month with an average gain of 1.12% with positive returns 78% of the time. In the 10 years where the S&P 500 was up more than 10% YTD through May, June was even stronger, averaging a gain of 1.50% with positive returns 73% of the time.

Source: Bespoke Investment Group
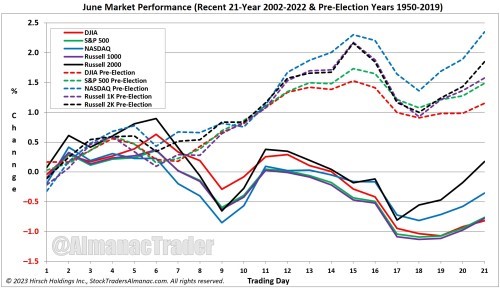
The second factor we wanted to highlight is the presidential election cycle. The fact that we find ourselves in a pre-election year in the U.S. also provides reason for optimism. As we can see in the following chart, the performance for major U.S. indices including the S&P 500 improve significantly during pre-election years (dotted lines) compared to the overall average from 2002 to 2022 (solid lines).

Source: The Chart Report, Hirsch Holdings Inc., StockTradersAlmanac.com
Sources: CNBC.com, Globe and Mail, Financial Post, BNN Bloomberg, Thomson Reuters, Refinitiv, Bespoke Investment Group, The Chart Report, Business Insider, Hirsch Holdings Inc., StockTradersAlmanac.com
©2023 Milestone Wealth Management Ltd. All rights reserved.
DISCLAIMER: Investing in equities is not guaranteed, values change frequently, and past performance is not necessarily an indicator of future performance. Investors cannot invest directly in an index. Index returns do not reflect any fees, expenses, or sales charges. Opinions and estimates are written as of the date of this report and may change without notice. Any commentaries, reports or other content are provided for your information only and are not considered investment advice. Readers should not act on this information without first consulting Milestone, their investment advisor, tax advisor, financial planner or lawyer. This communication is intended for Canadian residents only and does not constitute as an offer or solicitation by anyone in any jurisdiction in which such an offer is not allowed.