Market Insights: 200-Day Moving Average Turns Positive
Milestone Wealth Management Ltd. - May 26, 2023
Macroeconomic and Market Developments:
- North American markets were mixed this week. In Canada, the S&P/TSX Composite Index dropped 2.12%. In the U.S., the Dow Jones Industrial Average decreased 1.00% and the S&P 500 Index rose 0.32%.
- The Canadian dollar declined this week, closing at 73.45 cents vs 74.05 cents last Friday.
- Oil prices were mixed this week. U.S. West Texas crude closed at US$72.79 vs US$71.70 last Friday, and the Western Canadian Select price closed at US$50.58 vs US$50.69 last Friday.
- The price of gold weakened this week, closing at US$1,947 vs US$1,977 last Friday.
- The big story in the markets this week was the continued negotiations leading up to the U.S. government hitting its debt ceiling. No deal has been reached going into a U.S. long weekend, although both sides say they have made progress.
- Chevron (CVX) is acquiring PDC Energy (PDCE) for $72/share, representing a 10.6% premium to PDC's previous day’s closing price, in an all-stock deal valued at $6.3 billion or $7.6 billion including debt. Chevron said PDC Energy brings strong free cash flow, low breakeven production, and development opportunities adjacent to Chevron's position in the Denver-Julesburg Basin, as well as additional acreage to its Permian Basin position.
- Key indicators for the U.S. economy were released this week:
- The S&P Global flash U.S. Composite PMI Output Index, which tracks the manufacturing and services sectors, rose to a reading of 54.5 this month. That was the highest level since April 2022 and followed a final reading of 53.4 in April. It was the fourth straight month that the PMI remained above 50, indicating growth in the private sector.
- Revised GDP numbers show the U.S. economy grew at a 1.3% annual rate in Q1, a slight upgrade from its initial estimate of 1.1%.
- Inflation stayed stubbornly high in April. The PCE (Personal Consumption Expenditures) price index, which measures a variety of goods and services and adjusts for changes in consumer behavior, rose 0.4% for the month excluding food and energy costs; higher than the 0.3% estimate. On an annual basis, the gauge increased 4.7%, 0.1% higher than expected.
- U.S. chip maker Nvidia (NVDA) surged 24.37% on Thursday after it forecasted $11 billion in sales for the current quarter, citing demand for its graphics processors that power AI applications like the ones at Google, Microsoft and ChatGPT maker OpenAI. That forecast blew away Wall Street and turned the AI hype driving the stock into real results. The company’s market cap is now approaching US$1 trillion, which would put it in an elite club with only a handful of companies such as Apple, Microsoft, Alphabet and Amazon.
- Canadian bank earnings were in the spotlight this week:
- Before the market opened on Wednesday, Bank of Montreal (BMO) reported lower than expected earnings of $2.93/share ex-items vs $3.19/share expected, although revenue beat with $8.44 billion vs $8.06 billion expected. The bank increased its quarterly dividend by 2.8%.
- Also on Wednesday, Bank of Nova Scotia (BNS) reported an earnings miss with adjusted earnings of $1.70/share vs $1.77/share expected, on revenue of $7.93 billion vs $8.02 billion expected. BNS is also increasing its dividend by 2.9%.
- Before the open on Thursday, CIBC (CM) reported better than expected earnings of $1.70/share vs $1.63/share expected, with revenue of $5.70 billion which was right in line with expectations, and is increasing its quarterly dividend by 2.4%.
- Royal Bank of Canada (RY) reported lower than anticipated earnings of $2.65/share ex-items vs $2.79/share expected, although revenue beat expectations at $13.52 billion vs $12.86 billion expected, and has increased its quarterly dividend by 2.3%.
- And finally on Thursday, Toronto-Dominion Bank (TD) reported lower than expected earnings of $1.94/share ex-items vs $2.08/share, on adjusted revenue of $12.54 billion.
Weekly Diversion:
Check out this video: Why Saudi Arabia Keeps Announcing New 'Gigaprojects'
Charts of the Week:
Last week, the S&P 500’s 200-day moving average (DMA) halted its decline and has turned higher. As the indicator is a longer-term average, the pivot from negative to positive tends to take a while and reflects long-term market trends. As shown in the chart below, after hitting its lowest level in close to two years back in late March, the 200-DMA has started to turn higher and is currently just over 1% above that low.

Source: Bespoke Investment Group
As changes in the direction of the 200-DMA are infrequent, historically there have only been 20 other occurrences where the S&P 500’s 200-DMA made a 52-week low and then rallied more than 1% off that low within the next three months since the late 1920’s. The table below shows the S&P 500’s performance one month, three months, six months, and one year after each of those instances. The S&P 500 was up 75% of the time with average gains of 1.5% and 5.9% over the next one and three months, respectively. Six months later, the S&P 500 was up 85% of the time for an average gain of 11.5%. Lastly, one year later, the S&P 500’s average gain was 18.2% with gains 100% of the time. In terms of average gains, these are 2.5X to 3.3X the average gain over those times for all periods of time since 1928. In addition, after one year, this indicator was a perfect 20 for 20 positive!

Source: Bespoke Investment Group
Sticking with the S&P 500 Index, April marked another rare occurrence with the end of a 12-month consecutive negative rolling 12-month price return. Since 1945, there have only been nine prior occurrences, and each resulted in positive one-year returns (9 for 9) with the average return for each of the nine instances of 14.11%. Forward returns on average have been quite strong, well above the average for all periods, although mindful of some tougher cycles (1947, 1978) which one could argue we are currently in. While this by no means guarantees that the S&P 500 will be higher a year from now, it does strengthen the bull case when considered in combination with the prior indicator we shared.
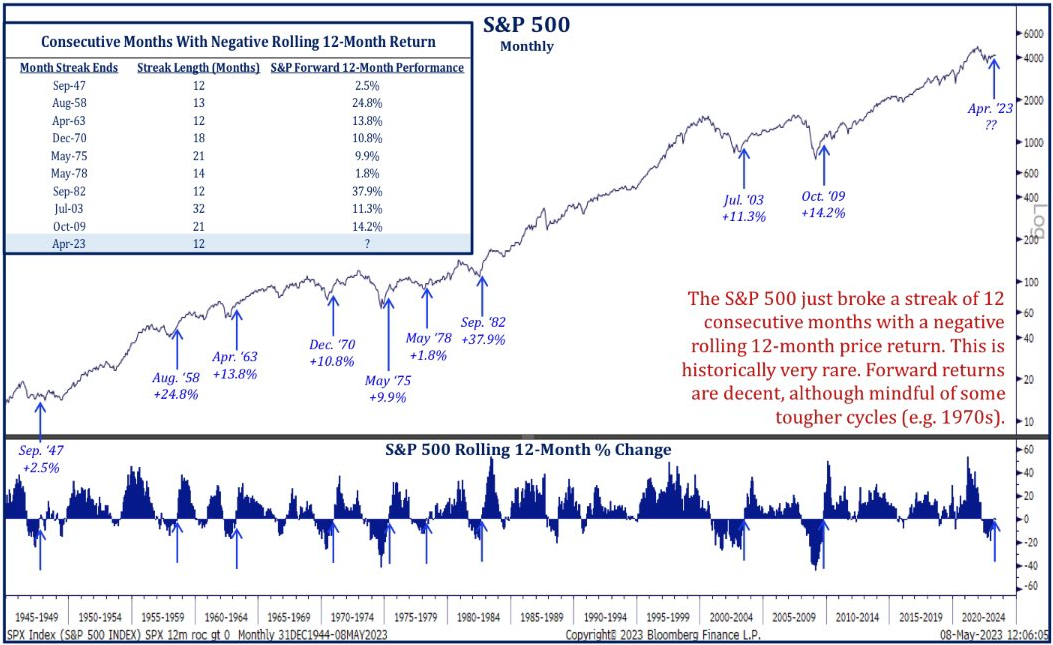
Source: The Chart Report, Bloomberg Finance L.P.
Sources: CNBC.com, Globe and Mail, Financial Post, BNN Bloomberg, Thomson Reuters, Refinitiv, Bespoke Investment Group, The Chart Report, Business Insider, Bloomberg Finance LP, RateInflation.com
©2023 Milestone Wealth Management Ltd. All rights reserved.
DISCLAIMER: Investing in equities is not guaranteed, values change frequently, and past performance is not necessarily an indicator of future performance. Investors cannot invest directly in an index. Index returns do not reflect any fees, expenses, or sales charges. Opinions and estimates are written as of the date of this report and may change without notice. Any commentaries, reports or other content are provided for your information only and are not considered investment advice. Readers should not act on this information without first consulting Milestone, their investment advisor, tax advisor, financial planner or lawyer. This communication is intended for Canadian residents only and does not constitute as an offer or solicitation by anyone in any jurisdiction in which such an offer is not allowed.