Market Insights: Improving Inflation
Milestone Wealth Management Ltd. - May 12, 2023
Macroeconomic and Market Developments:
- North American markets were down this week. In Canada, the S&P/TSX Composite Index decreased 0.60%. In the U.S., the Dow Jones Industrial Average declined 1.11% and the S&P 500 Index shrank by 0.29%.
- The Canadian dollar contracted this week, closing at 73.76 cents vs 74.77 cents last Friday.
- Oil prices were mixed this week. U.S. West Texas crude closed at US$70.12 vs US$71.32 last Friday, and the Western Canadian Select price closed at US$49.62 vs US$47.31 last Friday.
- The price of gold dropped this week, closing at US$2,011 vs US$2,017 last Friday.
- Inflation in the U.S. continued to cool in April. The Consumer Price Index (CPI) increased 4.9% from April 2022 to April 2023, slightly lower than the 5.0% predicted. The Core CPI, excluding volatile items like food and energy, came in at 5.5% from a year ago. Additionally, the U.S. Producer Price Index (PPI), a measure of prices for final demand goods and services, increased 0.2% month over month vs the estimate of 0.3%, with the core PPI rising 0.2%, in line with expectations. On an annual basis, the headline PPI increased just 2.3%, down from 2.7% in March and the lowest reading since January 2021.
- Earnings from some high-profile Calgary companies have been released over the past two weeks:
- Suncor Energy (SU) reported net earnings were $2.05 billion compared to $2.95 billion a year ago. Adjusted funds from operations were $2.26/share vs $2.23/share, and the company reported production of 742.1 Mboe/d vs 743.0 Mboe/d expected.
- Canadian Natural Resources (CNQ) reported a lower than expected Q1 adjusted funds flow of $3.08/share vs $3.11/share expected, with adjusted earnings of $1.69/share vs $1.65/share expected. The company’s net capital expenditure, excluding net acquisition costs and strategic growth capital, was $1.12 billion vs $1.30 billion expected and production of 1,319.4 MBoe/d vs 1,336.1 MBoe/d expected.
- Enbridge (ENB) reported better than expected Q1 distributable cash flow of $3.18 billion vs $3.04 billion expected, with adjusted EBITDA of $4.47 billion vs $4.29 billion expected, and earnings of $0.85/share, in line with forecasts.
- Pembina Pipeline (PPL) reported adjusted EBITDA of $947 million vs $905.5 million predicted, with capital expenditures of $137 million vs $203.0 million expected. Additionally, the company increased its quarterly dividend by 2.2% to $0.6675.
- Ovintiv (OVV) reported Q1 adjusted earnings of $450 million, a decrease of 20% from a year ago. Production came in at 511 Mboe/d vs 508.8 Mboe/d expected.
- Walt Disney Co (DIS) reported earnings after the close on Wednesday, the second earnings cycle since the return of Bob Iger to the CEO role. Earnings and revenue were in line with expectations with earnings at $0.93/share vs $0.93/share expected on revenue of $21.82 billion vs $21.79 billion expected. Disney’s streaming losses narrowed during the fiscal second quarter, as price increases helped offset the loss of subscribers at Disney+.
- Canadian tech company Absolute Software (ABST) is being acquired by Crosspoint Capital Partners for an approximate enterprise value of $870 million. The purchase price of US$11.50/share represents a 34% premium to the previous day’s closing price for Absolute.
- CI Financial Corp (CIX) is selling a 20% stake in its U.S. wealth management business to a group of investors including Bain Capital and Abu Dhabi Investment Authority. CI will use the money to pay down some of the debt it accumulated when it acquired dozens of wealth management offices in the U.S. in recent years. CI originally kicked off an IPO process for the U.S. business in late 2022, seeking to unlock value after its shares fell sharply, but opted for private investment instead.
Weekly Diversion:
Check out this video: School is tough
Charts of the Week:
The U.S. announced this week that the April year-over-year Consumer Price Index (CPI), a primary indicator of inflation, came in below estimates at 4.9% vs the expected 5.0%. Although this number is still higher than the 2-3% target for the Federal Reserve, the most recent decline marks a record 10th straight monthly drop from the 9.1% high recorded in June 2022. The chart below highlights this current record and previous consecutive monthly declines in year-over-year CPI since 1945.

Source: Bespoke Investment Group
The chart below shows an interesting trend that has recently emerged with CPI All Items coming in lower than CPI Less Food and Energy. This occurrence is a result of increases in shelter, gasoline, and used vehicles prices compared to lowering prices for fuel oil, new vehicles, and food at home. With food prices still being one of the most significant inflation factors for consumers, a decline in at home food prices is a welcome sight.

Source: CNBC, U.S. Bureau of Labor Statistics
Shifting to the markets, declining year-over-year inflation has typically been very beneficial, especially for the S&P 500. The following table and chart summarize the performance of the S&P 500 in the year after every prior period where the year-over-year change in CPI declined by five or more percentage points in a 12-month span, similar to the present situation (with no other occurrences in the prior year). Following these six historical periods, forward returns for the equity market were very positive. One and six months later, the S&P 500 was higher every time with median gains of 5.17% and 13.52%, respectively. Three and twelve months later, the S&P 500 was only down once, with median returns of 10.44% and 14.94%, respectively. Turning to the only year with negative three- and twelve-month returns, we can see that year-over-year CPI in the previous year was at 17.7%, significantly higher than the other 5 occurrences reported, and nearly double the June 2022 peak of 9.1% during the current inflationary cycle.

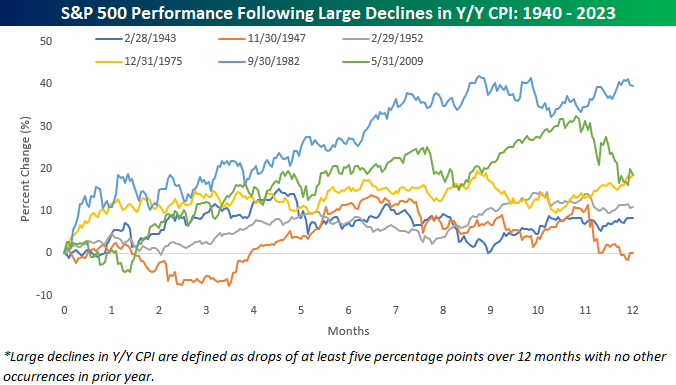
Source: Bespoke Investment Group
Canadian April CPI numbers will be reported next week on May 16th and early economists’ predictions have been reported, which point toward domestic numbers continuing to decline.
DISCLAIMER: Investing in equities is not guaranteed, values change frequently, and past performance is not necessarily an indicator of future performance. Investors cannot invest directly in an index. Index returns do not reflect any fees, expenses, or sales charges.
Sources: CNBC.com, Globe and Mail, Financial Post, Connected Wealth, BNN Bloomberg, Tony Dwyer, Canaccord Genuity, Bespoke Investment Group, First Trust, Seeking Alpha, Business Insider, U.S. Bureau of Labor Statistics