Market Insights: Short-Term Noise Vs. Longer-Term Trends
Milestone Wealth Management Ltd. - Feb 18, 2023
Macroeconomic and Market Developments:
- North American markets were down this week. In Canada, the S&P/TSX Composite Index dropped 0.47%. In the U.S., the Dow Jones Industrial Average decreased 0.13% and the S&P 500 Index declined 0.28%.
- The Canadian dollar was negative this week, closing at 74.21 cents vs 74.94 cents last Friday.
- Oil prices retreated this week. U.S. West Texas crude closed at US$76.29 vs US$79.79 last Friday, and the Western Canadian Select price closed at US$58.03 vs US$61.13 last Friday.
- The gold price weakened this week, closing at US$1,841 vs US$1,865 last Friday.
- U.S. inflation came in slightly higher than expected for the month of January. Consumer inflation, as measured by the Consumer Price Index (CPI), rose in January by 0.5% vs the 0.4% forecast and is up 6.4% year over year vs the 6.2% forecast. Excluding volatile food and energy, the core CPI increased 5.6% from a year ago, above the 5.5% expected. As well, the U.S. Producer Price Index (PPI) which measures inflation in wholesale prices, rose 0.7% in January, higher than the 0.4% estimate. Excluding food and energy, core PPI increased 0.5%, compared with expectations for a 0.3% increase.
- B2Gold (BTO) announced that it will acquire Sabina Gold (SBB) for $1.87/share. B2Gold will issue 0.3867 shares for each Sabina common share held, equating to a total equity value for Sabina of ~$1.1 billion.
- Ford (F) has confirmed plans to invest $3.5 billion to build a lithium iron phosphate battery plant in Michigan with the aid of Chinese battery giant CATL. The new facility will employ 2,500 people when production begins in 2026, somewhat offsetting the thousands of layoffs Ford has announced elsewhere in the company.
- TC Energy (TRP) reported better than expected quarterly earnings of $1.11/share vs $1.10/share expected. The pipeline company also announced that it has increased its quarterly dividend by 3.3% to $0.93/share from $0.90/share.
- Suncor Energy (SU) reported earnings of $1.81/share, slightly better than the $1.80/share expected, as well as better than expected cash flow of $3.11/share vs $3.00/share expected. The company also announced a quarterly dividend of $0.52/share, a 23.8% year over year increase.
- Here is a link to a short video from Canaccord’s chief U.S. Strategist Tony Dwyer titled New Data Reinforces Using a Slow Cooker in Microwave Market: Dwyer VLOG
Weekly Diversion:
Check out this video: Bernese Mountain Dog Puppy vs Lemon
Charts of the Week:
The S&P 500 is down 0.28% this week with market sentiment turning sour on higher-than-expected Producer Price Index (PPI) numbers and Consumer Price Index (CPI) numbers. With this week’s Charts of the Week, we wanted to break down these numbers to help put this information into context, as well as focus on some longer-term trends developing in the markets that can help filter through the short-term noise.
As stated in our Macroeconomic and Market Developments section, PPI rose 0.7% MoM in January, above the consensus rise of 0.4%, as well as CPI increasing by 0.5% MoM, above the consensus rise of 0.4%. These numbers indicate that the US Fed still has work to do and may need to continue raising rates to ensure that this high inflation does not stick. However, when we breakdown the Core-CPI numbers (excluding food and energy), things become more optimistic. As of January, core CPI rose 0.4% MoM however, and as seen in the table below, when we remove rent from the core CPI numbers, the annualized rate is much softer at 1.5%, below Fed targets. Again, the total core CPI number still shows there is work to be done, but we are starting to see signs of rate increases having the desired effect.

Source: Bespoke Investment Group
Switching focus to longer-term trends, the chart below shows the performance of the S&P 500 after 18 days of trading above the 200-day MA (Moving Average), which was just recently achieved Tuesday, February 14th. As we can see in all 11 previous occurrences since 1950, the average 3-, 6-, and 12-month return after the signal have always been positive. The numbers become more impressive when we consider the average return for 3-months after the prior occurrences was 6.7%, for 6-months after the prior occurrences was 12.7%, and for 12-months after the prior occurrences was 22.3%. Now, we try to avoid words like “always”, especially considering the relatively small sample size, but the information makes a compelling case for ignoring short-term noise and focusing on longer-term trends.
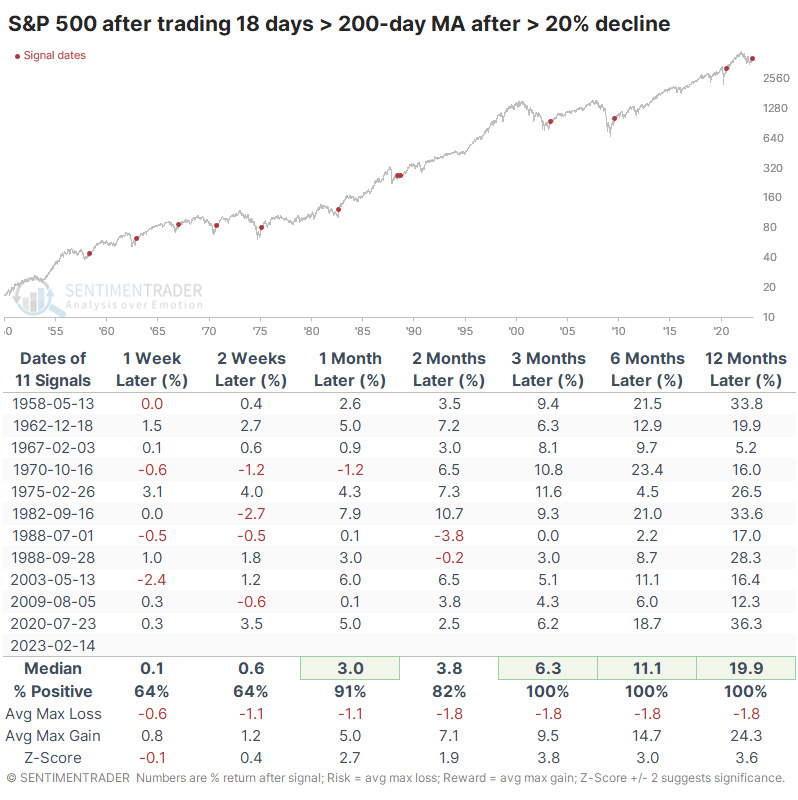
Source: The Chart Report, SentimenTrader - Sundial Capital Research Inc.
DISCLAIMER: Investing in equities is not guaranteed, values change frequently, and past performance is not necessarily an indicator of future performance. Investors cannot invest directly in an index. Index returns do not reflect any fees, expenses, or sales charges.
Sources: CNBC.com, Globe and Mail, Financial Post, Connected Wealth, BNN Bloomberg, Tony Dwyer, Canaccord Genuity, Bespoke Investment Group, First Trust, Seeking Alpha, The Chart Report, SentimenTrader-Sundial Capital Research Inc.