Market Insights: U.S. Dollar Index Suffers Big Decline
Milestone Wealth Management Ltd. - Nov 19, 2022
Macroeconomic and Market Developments:
- North American markets were down slightly this week. In Canada, the S&P/TSX Composite Index was down 0.65%. In the U.S., the Dow Jones Industrial Average fell by 0.01% and the S&P 500 Index declined by 0.69%.
- The Canadian dollar was negative this week, closing at 74.72 cents vs 75.43 cents last Friday.
- Oil prices fell this week. U.S. West Texas crude closed at US$80.13 vs US$88.96, and the Western Canadian Select price closed at US$53.19 vs US$59.59 last Friday.
- The gold price finished lower this week, closing at US$1,749 vs US$1,767 last week.
- The turmoil continued in the cryptocurrency world this week after crypto exchange FTX declared bankruptcy. Initial findings indicate that client assets were being comingled with FTX’s related hedge fund Alameda Research without client knowledge, putting billions of dollars worth of client crypto holdings at risk. The price of major cryptos dropped significantly over the past two weeks due to the resulting uncertainty, with Bitcoin hitting a low of ~$15,800 on Monday before a moderate recovery through the week, trading at ~$16,600 late Friday.
- The U.S. Producer Price Index (PPI), a measure of wholesale inflation, rose 0.2% in October, below the 0.4% estimate. A significant contributor to the slowdown was a 0.1% decline in services, the first outright decline in that measure since November 2020. On a year-over-year basis, PPI rose 8.0% compared to an 8.4% increase in September.
- The Canadian Consumer Price Index (CPI) rose 6.9% from a year ago, in line with economist expectations and matching the year-over-year increase in September. The index gained 0.7% during the month, just under the 0.8% month-on-month gain forecasted by economists.
- Canadian home prices continued their slide last month, with benchmark prices falling 1.2% to $756,200 in October. The drop marks the eighth month of price declines, with benchmark prices now down 10% from their peak in February. Additionally, CMHC reported that housing starts for all areas in Canada declined 11% in October to 267,000 compared to September's 2022 high of 299,000, but was in line with market expectations.
- This week saw big U.S. retailers report earnings in what has historically been a closely watched indicator for consumer financial health.
- On Tuesday morning, Walmart (WMT) announced its quarterly results, beating analysts’ expectations and as a result, raised its full-year outlook. Adjusted earnings came in at $1.50/share vs $1.32/share expected on revenue of $152.81 billion vs $147.75 billion expected. However, actual earnings were negative due to a $3.1 billion settlement tied to the opioid crisis.
- Also on Tuesday morning, Home Depot (HD) announced earnings and revenue above analysts’ expectations, with earnings of $4.24/share vs $4.12/share expected and revenue of $38.87 billion vs $37.96 billion expected.
- On Wednesday morning, Target (TGT) disappointed investors with earnings of $1.54/share, well below the $2.13/share expected, even with revenue up slightly at $26.52 billion vs $26.38 billion expected.
- Also on Wednesday, Lowe’s (LOW) blew past estimates with earnings of $3.27/share vs the forecasted $3.10/share, with revenue of $23.48 billion vs $23.13 billion expected.
- Here is a link to a short video from Canaccord’s chief U.S. Strategist Tony Dwyer entitled A Quiet Week with a Bunch of Noise: DWYER VLOG
Weekly Diversion:
Check out this video: I think he’ll have to take a penalty stroke on this one.
Charts of the Week:
Last week, the U.S. Dollar Index, which is a composite of the value of the U.S. dollar relative to a basket of its six largest foreign trading currency partners (including the Canadian dollar), suffered its fourth largest weekly decline (-4.1%) in at least 50 years, and just the sixth weekly decline of over 4%. This information may help explain, in part, the reason we have seen equities surge recently in the wake of last week’s lower than expected CPI reading. Here is a chart showing the prior points in time (red) where we have seen the U.S. Dollar Index fall more than 4% in a week.

Source: Bespoke Investment Group
The next table shows how the U.S Dollar Index has performed following these occurrences, and one can clearly note that this points to further weakness ahead for the U.S. dollar. We will point out that the Canadian dollar only makes up 9.1% of this index, so it doesn’t necessarily mean strength for the Canadian dollar.
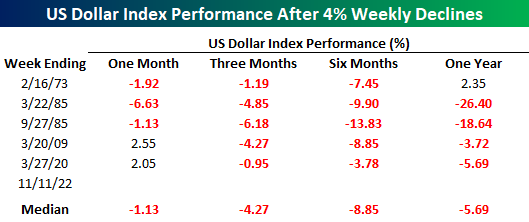
Source: Bespoke Investment Group
What does a weaker U.S. Dollar Index mean for equities? Although this is a very small sample size of just five prior occurrences, a weekly decline of this magnitude for the U.S. Dollar Index in the past has proven to be extremely positive for U.S. equities. As you can see in the following chart (red dots showing the past occurrences) and table, the S&P 500 has returned a median return of ~16% over the next three months, and ~30% over the next six and twelve months. The 1973 period was the only outlier, resulting in negative returns. This was also a period where inflation was rising; however, the instance in 1973 came before inflation exploded higher. Today, this has occurred after inflation has skyrocketed to 9%. Only time will tell if this is an important difference, and if this time will be more like the last four occurrences.
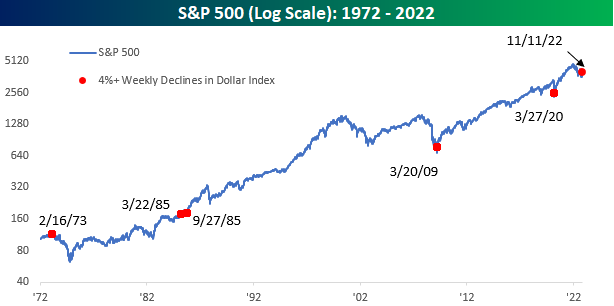
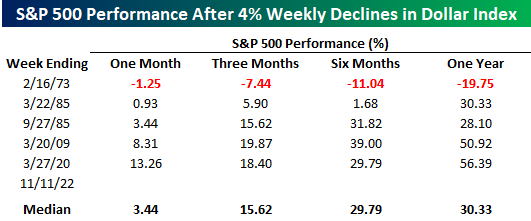
Source: Bespoke Investment Group
DISCLAIMER: Investing in equities is not guaranteed, values change frequently, and past performance is not necessarily an indicator of future performance. Investors cannot invest directly in an index. Index returns do not reflect any fees, expenses, or sales charges.
Sources: CNBC.com, Globe and Mail, Financial Post, Connected Wealth, BNN Bloomberg, Tony Dwyer, Canaccord Genuity, First Trust, Bespoke Investment Group