Market Insights: Welcome to October
Milestone Wealth Management Ltd. - Oct 07, 2022
Macroeconomic and Market Developments:
- North American markets were positive this week thanks to higher trading earlier in the week. In Canada, the S&P/TSX Composite Index was up 0.75%. In the U.S., the Dow Jones Industrial Average increased 1.99% and the S&P 500 Index advanced 1.51%.
- The Canadian dollar was up slightly this week, closing at 72.79 cents vs 72.38 cents last Friday.
- Oil prices were up significantly this week. U.S. West Texas crude closed at US$92.76 vs US$79.67, and the Western Canadian Select price closed at US$67.70 vs US$57.77 last Friday.
- The gold price was positive this week, closing at US$1,695 vs US$1,662 last week.
- The U.S. natural gas price, which had approached $10 in August, bottomed out on Monday at an intraday low of $6.47/MCF, a result of high U.S. storage levels and an outlook for mild temperatures that likely would keep demand in check. The price slowly climbed back somewhat throughout the week, closing at $6.65/MCF. On the flipside, oil rallied by 16.43% this week on news that OPEC+ will cut production by 2 million barrels per day. The actual reduction is projected to be closer to 1 million barrels, as most countries have not been able to produce up to the current quota.
- Canada's September Manufacturing Purchasing Managers Index (PMI) increased slightly to 49.8, but still remained below the 50 mark which differentiates between growth and contraction. Also, in the U.S., the ISM Manufacturing PMI came in at 50.9, still slightly in expansionary territory, but was below the 52.0 expected and the 52.8 level in August.
- TC Energy (TRP) announced it will begin pre-construction activities of the Saddlebrook Solar Project located south of Calgary near Aldersyde, investing $146 million to build its first Canadian solar power project. In related news, Calgary-based Canadian Utilities Limited (CU), which is an ATCO company, announced an agreement to acquire a portfolio of wind and solar assets and projects located in Alberta and Ontario from Suncor Energy (SU), for a purchase price of $730 million.
- Twitter (TWTR) share price popped higher on Tuesday on news that Elon Musk proposed to go ahead with the deal to purchase the social media platform at the original deal price of $54.20/share. Later in the week, regulators agreed to postpone the lawsuit against Musk regarding enforcing the takeover he had initiated.
- North American employment numbers were released on Friday. For Canada, the economy added 21,000 jobs last month, in line with estimates for a 20,000 gain. The unemployment rate fell to 5.2% as the labour force shrank, down from the 5.4% level in August. And in the U.S., Nonfarm Payrolls increased 263,000 for the month, compared to the estimate of 275,000. The unemployment rate was 3.5% vs the forecast of 3.7%, as the labour force participation rate edged lower to 62.3% and the size of the labour force decreased by 57,000.
- Here is a link to a short video from Canaccord’s chief U.S. Strategist Tony Dwyer entitled Watching 2-yr UST as Guide for the Low: DWYER VLOG
Weekly Diversion:
Check out this video of a lemur who won’t take no for an answer.
Charts of the Week:
It has been another wild week for equity markets, starting off extremely strong with back-to-back 2%+ days, but then fading over the last couple days. At least markets were up for the week, slowing down a harsh multi-week slide (6 out of 7 negative weeks) from August 12th to September 30th where the S&P 500 Index and S&P/TSX Composite fell 16.23% and 8.60%, respectively. With unprecedented negative sentiment levels and extreme oversold measures in late September, it may be fitting that we are now here in October, which has historically been synonymous with major bottoms. Welcome to October, where major market lows, as defined by an 18-month low, have occurred more than any other month by far (see chart below). It would be great for this October, in hindsight, to ultimately mark the 10th major market low.

Sources: Callum Thomas, Ari Wald & Sam Ro
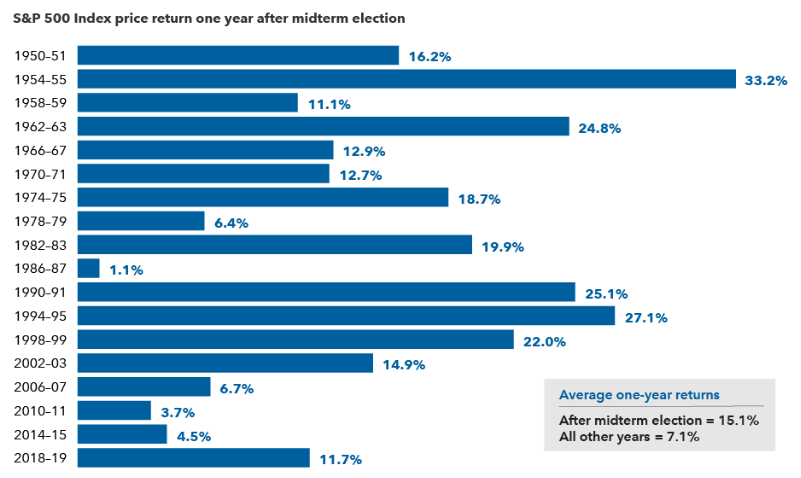
With some sentiment measures at all-time lows (a positive contrarian signal), with equity valuations now at or below long-term averages, with positive seasonal headwinds from mid-October through April, and with the fact that we are now close to getting past the U.S. mid-term elections, there are some positives to grasp onto knowing that the stock market is a forward pricing mechanism, rather than rear-view. Historically, as the following chart shows, the one-year period after the mid-term election of a U.S. Presidential cycle has been the best time to invest. Clearly many obstacles remain for risk assets at present, namely high inflation, and an unprecedented monetary tightening cycle, however, the market has already priced in much of this negative news. As harsh as this correction has been this year - not just for equities but also for traditionally more conservative fixed income - the current secular bull market (very long-term trendline) that began in 2009 remains intact. We will now very likely be entering a period of disinflation (slowing pace of price inflation) and we will likely see a terminal rate of interest sometime in the next few months. Although we could see further volatility and declines, this disinflation and U.S. Fed policy shift later this year/early next year could be a strong positive catapult for risk assets next year.

Source: Capital Group, RIMES, Standard & Poor’s. Calculations use Election Day as the starting date in all election years and November 5th as a proxy for the starting date in other years. Only midterm election years are shown in the chart. As of 12/31/21.
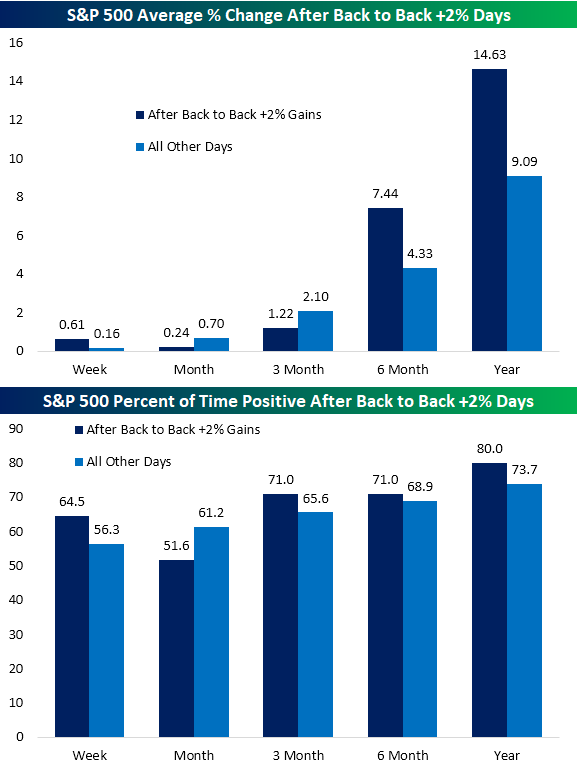
We started our comments off this week noting that it was a wild one. Let’s first look at the fact that the S&P 500 (TSX Composite as well) started the week with back-to-back increases of over 2%. This is the first time this has occurred since March 2020. Back-to-back gains of over 2% are rare for any point in the calendar, but they are exceedingly rare to start a month. In fact, since 1953, there has only been one other time when this has happened, August 1984. The following chart shows how the S&P 500 has performed on average after all instances (31) of back-to-back +2% days. As you can see, short-term results were typically lackluster, but over periods of 6 and 12 months later, markets were up significantly more than all other periods and with a higher positive rate.

Source: Bespoke Investment Group
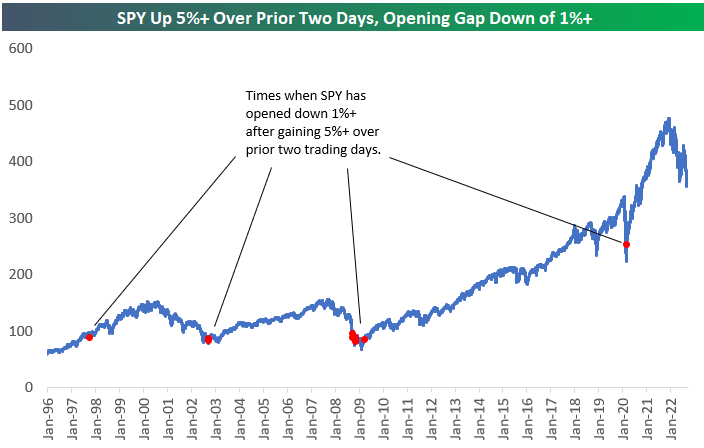
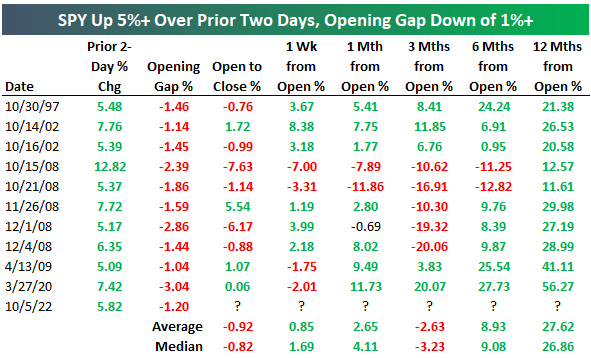
After this extremely strong two-rally of 5.8% for the S&P 500, it gapped down (prior to open) on Wednesday by over 1%. This was another rare occurrence, only the 11th time in history where we have seen a +1% gap down after a two-day rally of over 5%. While a quick rebound after an instance like this should not be expected at all, if you follow the process and take the long view this could be viewed as a big positive in combination. As you will note in the following chart, these past 11 instances are all clustered in four areas, all of which were close to major market lows, especially the last three times. As you can imagine, looking where those red dots lie, it won’t be surprising to see the next table show how markets have historically performed one year later. In all ten prior occurrences, the S&P 500 was positive after 12 months, with an average increase of over 27%, well above twice the average rate for all other periods.


Source: Bespoke Investment Group
Sources: CNBC.com, Globe and Mail, Financial Post, Connected Wealth, BNN Bloomberg, Tony Dwyer, Canaccord Genuity, First Trust, Bespoke Investment Group, Thomson Reuters, Oppenheimer & Co, Callum Thomas/Ari Wald/Sam Ro, Capital Group, RIMES, Standard & Poors
DISCLAIMER: Investing in equities is not guaranteed, values change frequently, and past performance is not necessarily an indicator of future performance. Investors cannot invest directly in an index. Index returns do not reflect any fees, expenses, or sales charges.