Market Insights: S&P 500 Valuations Back to Normal
Milestone Wealth Management Ltd. - Jul 15, 2022
Macroeconomic and Market Developments:
- North American markets were down strongly in Canada but only down slightly in the U.S. In Canada, the S&P/TSX Composite Index was down 3.3%. In the U.S., the Dow Jones Industrial Average declined 0.16% and the S&P 500 Index fell 0.93% this week.
- The Canadian dollar was down again this week, closing at 76.72 cents vs 77.20 cents USD last Friday.
- Oil prices were down significantly this week. U.S. West Texas crude closed at US$97.49 vs $104.79 last Friday.
- The price of gold price declined this week, closing at US$1703.60 vs $174230. last Friday.
- The U.S. Consumer Price Index (CPI) increased 1.3% in June, above the consensus expected +1.1%. The CPI is up 9.1% from a year ago. Energy prices increased 7.5% in June, while food prices increased 1.0%. The “core” CPI, which excludes food and energy, rose 0.7% in June, above the consensus expected +0.5%. Core prices are up 5.9% versus a year ago.
- Real average hourly earnings – the cash earnings of all workers, adjusted for inflation – declined 1.0% in June and are down 3.6% in the past year. Real average weekly earnings are down 4.4% in the past year. However, aggregate wages and salaries are still up significantly over 10% in the last two years even after inflation.
- The U.S. Producer Price Index (PPI) rose 1.1% in June, coming in above the consensus expected +0.8%. Producer prices are up 11.3% versus a year ago. Energy prices rose 10.0% in June, while food prices increased 0.1%. Producer prices excluding food and energy rose 0.4% in June and are up 8.2% in the past year. In the past year, U.S. prices for goods are up 17.9%, while prices for services have risen 7.7%. Private capital equipment prices increased 0.7% in June and are up 12.7% in the past year.
- U.S. Retail sales rose 1.0% in June (+1.1% including revisions to prior months), narrowly beating the consensus expected gain of 0.9%. Retail sales are up 8.4% versus a year ago. “Core” sales, which exclude the most volatile categories of autos, building materials, and gas stations, rose 0.8% in June, are up 6.8% from a year ago, and up 26.8% versus the pre-COVID level of February 2020. If it were not for recent inflation levels, this would normally be considered very robust.
- Canadian home prices saw their biggest monthly decline in at least 17 years as the impact of higher interest rates began to spread across the country. The benchmark price of a home fell 1.9 per cent in June versus the previous month, according to data released Friday by the Canadian Real Estate Association.
- On Wednesday, the Bank of Canada has raised its benchmark interest rate by a full percentage point to 2.5%, the largest one-time increase in the bank’s rate since 1998, sharply increasing the cost of borrowing in an attempt to rein in inflation. On Thursday, Canadian banks subsequently raised their prime lending rates from 3.7% to 4.7%.
- Here is a link to a short video from Canaccord’s chief U.S. Strategist Tony Dwyer entitled A Market Signal, Inflation, and the Fed: DWYER VLOG
Weekly Diversion:
For all you dog lovers, check out this video of a half dog/half kangaroo. Sort of.
Charts of the Week:
This week we wanted to share a couple charts from our second quarter market commentary. The table below shows the worst twenty six-month periods for the U.S. Wilshire 5000 Index (more encompassing index than S&P 500), with the current period highlighted in blue. As illustrated, and perhaps not surprisingly, forward returns have been extremely high after that point relative to all periods.

Source: Charlie Bilello, Compound Capital Advisors, LLC
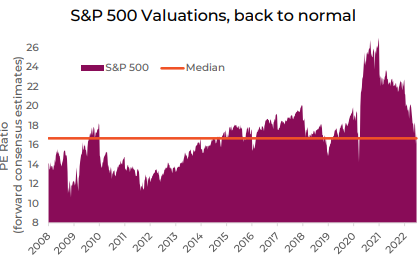
In addition, with the recent correction in markets, valuations have come right back down to normal to slightly under the long-term average. This should provide significant support for markets as institutions look to add to their equity exposure at these levels. The PE Ratio is on the horizontal axis. This is what is known as the price/earnings multiple and in general the mostly widely followed measure of stock valuations. Quite often what is reported is the 12-month PE ratio (rear-view looking), but this is referencing the forward consensus PE estimates, which in our view is more important as it already factors in all the earnings revisions which have come down over the last few months. As we have reiterated recently, we believe there is a good setup for at least a short to intermediate-term rally for markets over the summer, with inflation peaking right now and set to decline as the year progresses, and with markets likely already pricing in all the rate hikes we are going to see this year. As we have noted in our quarterly commentary, U.S. households remain relatively strong, and with the market having priced in a significant amount of negatives, we could see some upside surprises over the coming months.

Source: Connected Wealth, Purpose Investments, Bloomberg
Sources: CNBC.com, Globe and Mail, Financial Post, Connected Wealth, BNN Bloomberg, Tony Dwyer, Canaccord Genuity, First Trust, Compound Capital Advisors LLC, Connected Wealth, Purpose Investments