Market Insights: Investor Pessimism Spikes Again
Milestone Wealth Management Ltd. - Jun 17, 2022
Macroeconomic and Market Developments:
- North American markets were down hard again this week. In Canada, the S&P/TSX Composite Index was down 6.63% as selling in the overall markets finally made its way into oil and gas stocks as well. In the U.S., the Dow Jones Industrial Average declined 4.80% and the S&P 500 Index fell 5.80% this week.
- The Canadian dollar was down this week, closing at 76.75 cents vs 78.26 USD cents last Friday.
- Oil prices declined significantly this week. U.S. West Texas crude closed at $110.07 vs $120.44 USD last Friday, and the Western Canadian Select price closed at $89.86 vs $101.62 last Friday.
- The gold price was also down this week, closing at $1,837 vs $1,871 USD last Friday.
- The big news in the financial world this week was the much-watched announcement by the U.S. Federal Reserve on Wednesday. The central bank raised their benchmark interest rate by 0.75%, the biggest move since 1994, in a bid to rein in inflation. The rate has now risen from a range of 0.00 – 0.25% at the start of the year to a range of 1.50 – 1.75%.
- Cenovus Energy (CVE) announced that it has reached an agreement to purchase the remaining 50% of the Sunrise oil sands project in northern Alberta from BP. Total consideration for the transaction includes $600 million in cash, a variable payment with a maximum cumulative value of $600 million expiring after two years, and Cenovus's 35% position in the undeveloped Bay du Nord project offshore Newfoundland and Labrador.
- Another measure of inflation called the Producer Price Index (PPI) rose 0.8% in May in the United States, matching expectations, and are up 10.8% year over year. Energy prices rose 5.0% in May, while food prices were unchanged. Core producer prices (excluding food and energy) rose 0.5% in May and are up 8.3% in the past year. In the past year, prices for goods are up 16.6%, while prices for services have risen 7.6%.
- LifeWorks (LWRK) announced that it has entered into an agreement to be sold to Telus (T) for ~$33.00/share in cash and/or stock. The total transaction is valued at approximately $2.9 billion, including the assumption of debt.
- Bausch Health (BHC) announced this week that it is pausing the proposed initial public offering of its Solta Medical business due to the challenging market conditions. The company will revisit alternative paths for Solta in the future.
- Deputy Prime Minister Freeland laid out the Trudeau government's $8.9 billion plan to battle inflation, although some of the plan seems to rely on existing programs. Freeland warned that a soft-landing for the Candian economy is not guaranteed, while showing support for the Bank of Canada’s monetary policy decisions.
- Here is a link to a short video from Canaccord’s chief U.S. Strategist Tony Dwyer entitled Money Availability Drives Our Core Thesis: DWYER VLOG
Weekly Diversion:
Here is a video of some of the most amazing hikes in Banff National Park.
Charts of the Week:
“The stock market is a device to transfer money from the impatient to the patient” – Warren Buffett
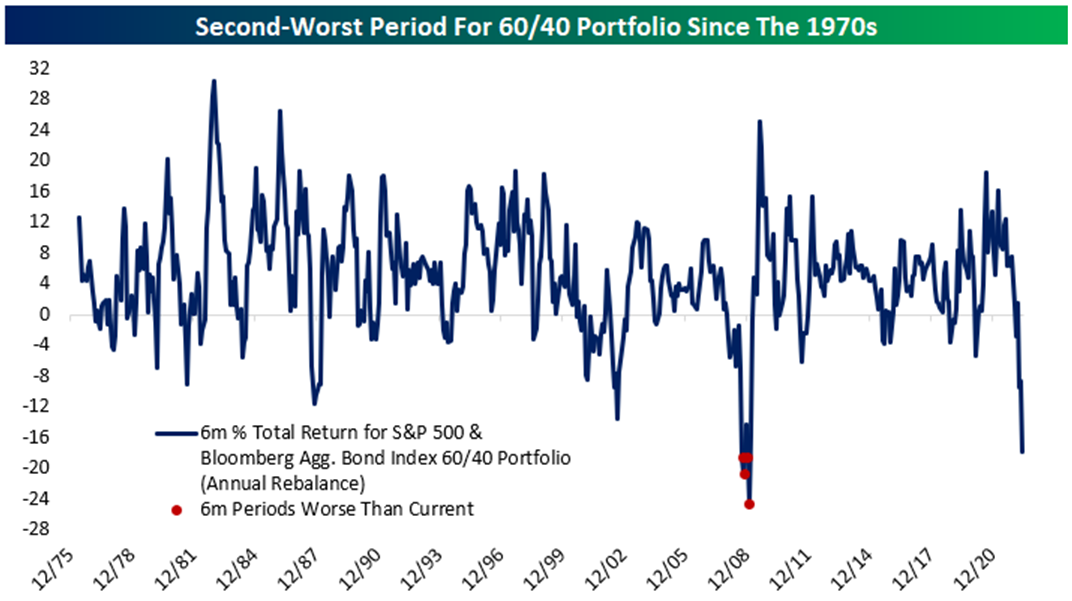
It has been another very difficult period for markets these past two weeks, with the biggest news being that the U.S. Federal Reserve raised its benchmark interest rate by the largest amount since 1994, by 0.75% to a range of 1.50% - 1.75%. There will likely be 0.50% rate hikes (possibly 0.75%) at the next couple of Fed meetings as well. This is probably a good thing long-term in that they are acting swiftly now in an effort to curb inflation, it demonstrates to the market that they mean business and would likely be somewhat bullish for markets once fully priced in. The equity markets have already telegraphed this move, however, and so the last few weeks have taken a toll. However, what is different this time from prior corrections is that with the sharp rise in long-term interest rates, the bond markets have not provided the usual safe haven from equities. For example, here in Canada, the FTSE Canada Universe Bond Index (-13.5% YTD) is actually down significantly more than the S&P/TSX Composite which has been one of the best equity markets in the world this year. For the U.S., the S&P 500 has not been as fortunate as the TSX, primarily due to its higher growth (tech) weighting, and is now down over 22% YTD. Therefore, the typical balanced 40/60 (fixed income/equity) portfolio for the U.S. has endured its worst start to a year since at least 1976. In addition, the 6-month decline of a 40/60 portfolio is the second worst since that time, with only the early 2009 period exceeding it. In fact, as the next chart shows, the current drawdown of a balanced portfolio in the U.S. is not that far off 2009, at the depths of the Global Financial Crisis.

Source: Bespoke Investment Group
At Milestone, our core balanced mandates are not the traditional 40/60 asset allocation, as we have always incorporated allocations to real assets and absolute returns into our mix, as well as some private credit, with the intent to have characteristics of endowment funds like Yale. These private REITs, hedge funds and credit funds can provide additional non-correlating return streams that tend to perform well during public equity/fixed income market drawdowns, and in the case of real assets, perform well during periods of higher inflation. These allocations, in addition to some elevated cash levels, have benefitted our cores mandates so far this year on a relative basis. We did anticipate higher interest rates, even though admittedly the spike in rates and inflation has occurred much faster and steeper than forecasted.
Based on the recent drop of just the last week or two, we know that the stock markets (which act as a leading indicator) have already priced in a significant slow down or even a recession this year. According to analysts at JPMorgan, the state of the S&P 500 implies an 85% chance of recession, which actually means the U.S. could already be in one or entering one shortly. We know though that the start of a recession is not known for many months after. What is different this time, however, is that U.S. households are in a stronger financial position and have much more cash on hand vs. prior recessions, and the unemployment rate is historically low. We believe this will be an important factor to help the economy get through this post-Covid transition from a goods-based economy back to a service-based economy which the U.S. primarily is. Moreover, valuations are now very reasonable, not just in the context of recent history but all history, with the forward price/earning multiple for global equities down to just 13.7X which is well below average. There are likely negative earnings revisions on tap in the near future, but stocks are certainly at least fairly valued historically at this point. Any good news in the coming months could result in a very strong rally for risk assets.
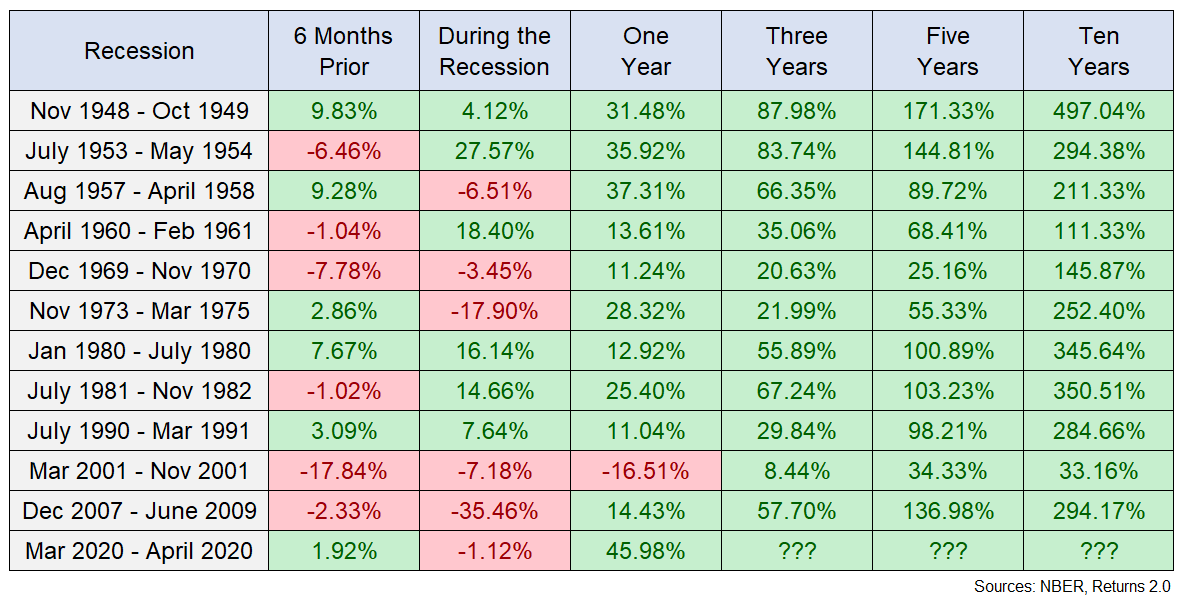
If one can focus on the long-term, the positive news is that the forward-looking returns are now very strong and for those with capital on the sidelines, history has proven to reward those who can invest into the market during these times or for others, stay invested. As one of the world’s best investors, Warren Buffett, has been quoted as saying, “the stock market is a device to transfer money from the impatient to the patient”. This is certainly true right now with high levels of selling on the retail side and large quantities of purchasing at the institutional level. At every point in time, there is always a seller and buyer, and those that are buyers now will likely have more success than the sellers long-term. The following table is a look at every recession since WWII along with the S&P 500 returns in the six months leading up to a recession, during the actual recession and one, three, five and ten years from the end of a recession. Outside of the 2000 - 2009 secular bear market, long-term returns in the past have been extremely strong at this point. However, we do not believe we are in a secular bear market, but a cyclical bear market within a long-term secular bull market that began after 2009, with past secular bull markets usually lasting at least 15 - 20 years. In fact, according to Fidelity research data, the average secular bull market has lasted 21.2 years.

Source: Ben Carlson, https://awealthofcommonsense.com/
History has shown time and time again that making any hasty short-term decisions after this type of decline is the worst possible thing one could do within a long-term plan. Markets are now in a bear market, but we have recently witnessed historically oversold technical readings and extreme levels of pessimism, that usually occur near long-term bottoms. Early this week, less than 5% of all S&P 500 companies were above their 50-day moving average. That is the lowest since the March 2020 pandemic sell-off and is a very uncommon occurrence. Both the Q4 2018 and Q1 2020 sell-offs reversed course shortly after similar instances with strong rallies afterwards.
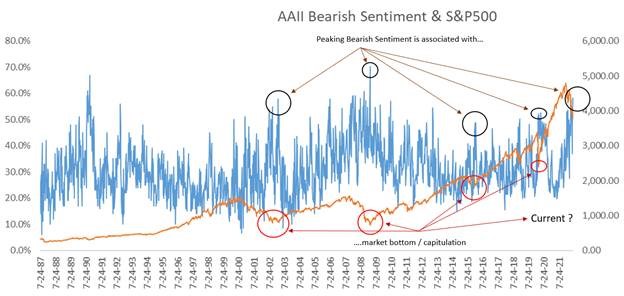
The following chart shows that bearish investors are at 58% in the Investor Sentiment Survey reading of American Association of Individual Investors (AAII). Historically, at times when the sentiment went this bearish (negative), the market demonstrated upside strength and was at least close to a bottom.

Source: Purpose Investments, AAII
The following chart shows how the S&P 500 has performed in the past after entering a bear market. Over the following year, the market has returned 22.7% on average which is more than double the stock market’s long-term average. One thing to note here as well is the following 10-year period. What this tells you is that time in the market is more important than timing the market, because even buying the market at some of its lowest points in time only provides a small amount of benefit over the long-term.

Source: Mark Hulbert, MarketWatch
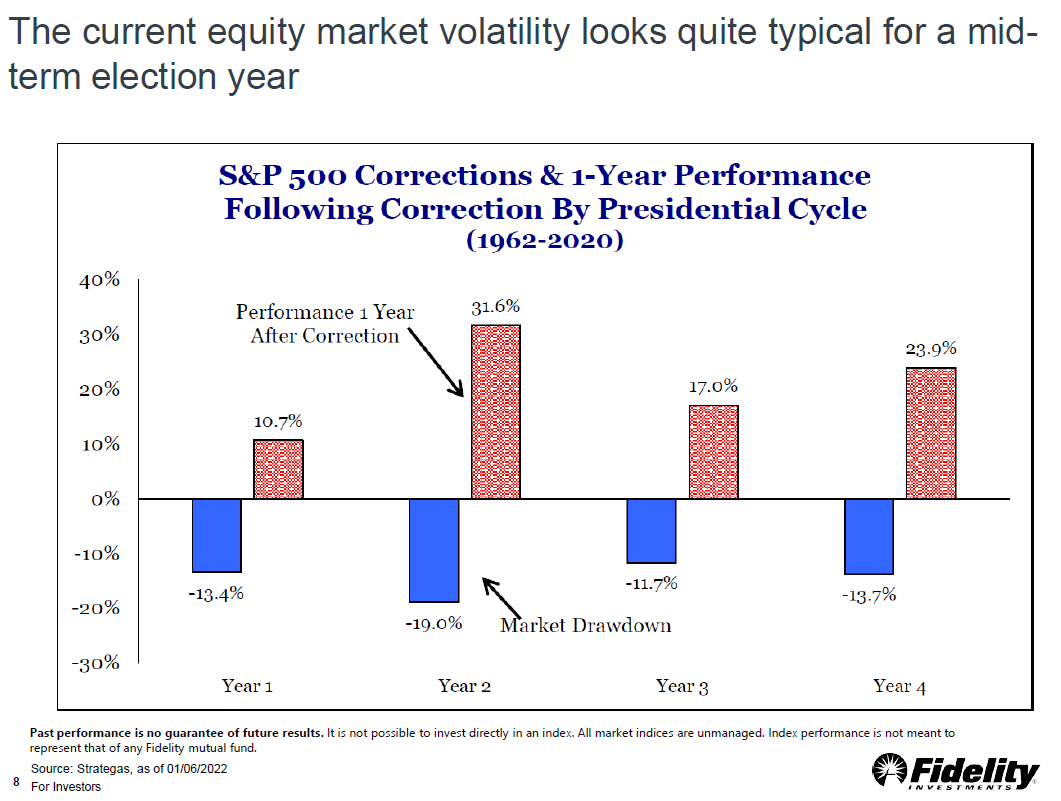
We will finish off with a chart that shows the historical average intra-year market drawdowns for the S&P 500 over each year of the U.S. presidential cycle through 2020. The second year (like this year) has historically been the most volatile. Although this year’s drawdown has been extreme and worse than average, it isn’t as atypical as one may think. The fact that this year’s drawdown started right at the very beginning of the calendar year has also made this feel worse than normal. On the flip side, however, the average performance one year after the correction has been historically very strong at 31.6%.

Source: Fidelity Investments
Sources: CNBC.com, Globe and Mail, Financial Post, Connected Wealth, BNN Bloomberg, Tony Dwyer, Canaccord Genuity, First Trust, Bespoke, Fidelity, JPMorgan, Hulbert Ratings, MarketWatch, A Wealth of Common Sense blog, Purpose Investments, AAII