Market Insights: Oversold Readings Finally Reached
Milestone Wealth Management Ltd. - Sep 24, 2021
Macroeconomic and Market Developments: North American markets were volatile beginning with a big sell-off on Monday but recovered and ended mixed by the end of the week. In the U.S., the Dow Jones Industrial Average increased 0.62% and the S&P 500
Macroeconomic and Market Developments:
- North American markets were volatile beginning with a big sell-off on Monday but recovered and ended mixed by the end of the week. In the U.S., the Dow Jones Industrial Average increased 0.62% and the S&P 500 Index increased 0.51%. In Canada, the S&P/TSX Composite Index was down 0.46%.
- The Canadian dollar was positive this week, closing at 79.08 cents vs 78.40 cents last Friday.
- Oil prices were up this week. US West Texas crude closed at $73.96 vs $71.96 last week, and the Western Canadian Select price closed at $62.19 vs $59.90 last week. Brent crude, which is the international benchmark, closed at $78.00 which is the highest close since October 2018.
- Gold prices were down slightly this week, closing at $1,748 vs $1,753 last Friday.
- The big news story driving markets this week was the unfolding debt crisis for Evergrande Property Group. The Chinese company, trading on the Hong Kong market, is perilously close to being unable to pay its upcoming interest payments on its roughly US$300 billion in debt. This week it was able to negotiate with creditors to settle one interest payment due to domestic Chinese investors. However, on Thursday another ~US$83 million interest payment was due and there has been no news on that, but that was to non-domestic creditors, to whom Evergrande has a 30-day grace period.
- Canadian company Brookfield Asset Management (BAM.a) proposed to buy Australian utility company AusNet Services for A$2.50/share in cash. The proposal values AusNet at A$9.57 billion (US$6.92 billion). Australian energy infrastructure firm APA Group then started a bidding war by topping Brookfield with an offer of A$9.96 billion (US$7.22 billion) in a mixture of cash and stock.
- Oil giant Royal Dutch Shell announced Monday a deal to sell the entirety of its Permian Basin assets to ConocoPhillips (COP), marking Shell’s complete withdrawal from onshore production in Texas. ConocoPhillips is purchasing the West Texas business for US$9.5 billion in cash with the deal set to close in the fourth quarter this year. Investors liked the news, pushing ConocoPhillips’s stock price up 10.3% on the week.
- The Ontario Teachers’ Pension Plan has entered into an agreement to acquire HomeQ Corporation, the parent company of HomeEquity Bank, which is the leading Canadian bank that offers reverse mortgage solutions, including its flagship CHIP Reverse Mortgage. Ontario Teachers will obtain ownership of HomeQ from its major owner Birch Hill Equity Partners, as well as other minority shareholders.
- The Federal Reserve, the United States central bank, met this week and announced at the conclusion on Wednesday that it is holding its benchmark interest rates near zero. However, it also indicated that rate hikes could be coming sooner than expected, although it significantly cut its economic outlook for this year. “If progress continues broadly as expected, the Committee judges that a moderation in the pace of asset purchases may soon be warranted,” the post-meeting statement said. For now, the committee voted unanimously to keep short-term rates anchored near zero, however more members now see the first rate hike happening in 2022.
- Canadian Retail Sales fell 0.6% in July, down to $55.8 billion, the third decrease in four months. The decline was primarily driven by lower sales at food and beverage stores (3.4%) and building material and garden equipment and supplies dealers (7.3%). Statistics Canada added an advance estimate of retail sales, which suggests that sales increased 2.1% in August.
- Here is a link to a short video from Canaccord’s chief U.S. Strategist Tony Dwyer entitled Updating Transitional Whoosh: DWYER VLOG
Weekly Diversion:
Check out this news anchor having fun on commercial breaks.
Charts of the Week:
After two straight weeks of equity market declines that carried further downside into the first part of this week, we are finally starting to see some oversold readings. An equity index is considered to be at an oversold level when it trades at more than one standard deviation below its 50-day moving average, in other words the bottom 16% of observations around that level. In the very short-term, these can be viewed as a negative as you go through the correction, but within the context of a solid longer-term uptrend, these readings can be a welcome sign of a pause and potential set-up for another leg higher, especially as we are only a few weeks away from the beginning of the historically seasonal strong period for equities. In addition, the fact that we have only seen a maximum peak to trough drawdown of -5.3% for the S&P 500 and -4.4% for the S&P/TSX Composite while at the same time hitting oversold levels, is a strong indication of the strength of the underlying market.
On Monday, the S&P 500 closed at oversold levels for the first time in 220 trading days, ending the longest streak without an oversold reading in over 25 years. The last time we saw an oversold level was the day before the U.S. election last November, which was the longest streak since a 333-day stretch that ended way back in April 1996. That event is quite the feat, and again, an indication of market strength.

Source: Bespoke Investment Group
After such a long steady streak, one may tend to think we would be now due for a period of underperformance; however, historical data has shown that forward-looking returns following the end of prior such streaks has been relatively strong. The table below shows all the past instances where the S&P 500 ended streaks of nine or more months without an oversold reading back to 1945 (i.e., without closing more than one standard deviation below its 50day moving average). This issue is a rare occurrence, so any forward-looking data from a small subset may not be overly meaningful; however, it does show that in prior times the S&P 500 performed much better than all other periods over the following year and with a higher positive success rate. Over the next three- and six-month periods following such instances, the S&P 500 has actually performed twice as strong as all other times on average with positive rates of 90-100% of the time, and over the next year it has outperformed all other periods by 4.6% on average.


Source: Bespoke Investment Group
In addition to the overall market hitting oversold levels earlier this week, we also saw strong net oversold breadth levels where the difference between the number of stocks that closed at oversold levels vs. overbought levels was very large. As of the close this past Tuesday, only 6% of companies were overbought while 47% were oversold. The net reading of those two numbers was -41.2 percentage points which is a bottom decile reading since 2007. There have been numerous situations where the divergence between oversold and overbought levels has been even greater, but the last time we saw it this extreme was exactly a year ago yesterday on September 23, 2020. If we scrub the data only for instances where this reading was in the bottom decile and where it hadn’t hit such an oversold level in 90 days or more, we get 19 other times as per the following table. This data is a larger sample size than above, and fortunately the forward-looking returns in prior times have also been very positive. We chalk up both data set situations and positive forward returns to likely be due to the fact that markets that have been on a solid trend with low volatility tend to stay in that trend for longer than many anticipate. As the classic stock market pearl of wisdom states “the trend is your friend”. Of note in the data set below, although the following one-year average max drawdown levels have been roughly the same as all other times (read: volatility has been similar), the average return over the following three, six and twelve months have been far stronger than normal (3% higher than average over the following year) and with strong positive success rates. In fact, since 2009, there has only been once instance out of the past 16 times when such a bottom decile oversold-overbought reading was not followed by a move higher one year out.

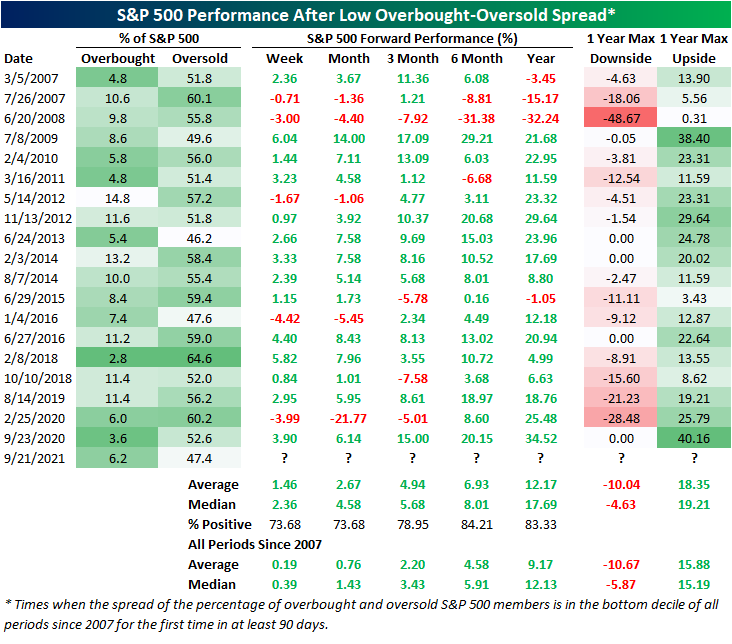
Source: Bespoke Investment Group
Sources: CNBC.com, Globe and Mail, Financial Post, BNN Bloomberg, Tony Dwyer, Canaccord Genuity, First Trust, Bespoke Investment Group, Wealth Professional