Market Insights: September Seasonal Headwinds?
Milestone Wealth Management Ltd. - Sep 03, 2021
Macroeconomic and Market Developments: North American markets were mixed this week. In Canada, the S&P/TSX Composite Index was up 0.94%. In the U.S., the Dow Jones Industrial Average declined 0.25% and the S&P 500 Index was up 0.58%. The Canadian dol
Macroeconomic and Market Developments:
- North American markets were mixed this week. In Canada, the S&P/TSX Composite Index was up 0.94%. In the U.S., the Dow Jones Industrial Average declined 0.25% and the S&P 500 Index was up 0.58%.
- The Canadian dollar was positive this week, closing at 79.81 cents vs 79.25 cents last Friday.
- Oil prices were slightly positive this week. US West Texas crude closed at $69.26 vs $68.73 last week, and the Western Canadian Select price closed at $57.25 vs $56.37 last week.
- Gold prices were up this week as well, closing at $1,828 vs $1,820 last Friday.
- On Monday, Enerplus (ERF) announced that it has entered into an agreement to sell its interests in the Sleeping Giant field in Montana and the Russian Creek area in North Dakota in the Williston Basin for total consideration of $115 million.
- CN Rail’s proposed takeover of Kansas City Southern hit a roadblock on Tuesday with the US Surface Transportation board announcing a unanimous decision rejecting the use of a voting trust agreement in connection with the proposed transaction. CN Rail responded by stating that it is evaluating its options while remaining confident that its pro-competitive, end-to-end combination is in the public interest. In turn, CP Rail has set a deadline of September 12th for their competing bid.
- China’s August Non-Manufacturing PMI (Purchasing Managers Index) unexpectedly fell by almost 5.8 points, dropping from 53.3 to 47.5, moving into sub-50 contractionary territory for the first time since the earlier days of COVID in Feb 2020 (levels higher than 50 signal expansion; levels below 50 signal contraction). The Manufacturing PMI also came in a tick below expectations but remained barely in expansionary territory at 50.1 vs 50.4 last month.
- The US economic data was decidedly more positive with the ISM Manufacturing Index rising to 59.9 in August, beating the expectations of 58.5. The major measures of activity were mixed in August, but nearly all were above 50, signaling growth. The production index rose to 60.0 from 58.4 in July, while the new orders index rose to 66.7 from 64.9. The employment index fell to 49.0 from 52.9, and the supplier deliveries index fell to 69.5 from 72.5 in July.
- On the non-manufacturing side, the ISM Services index for August came in at 61.7, just beneath the 62.0 expectation. However, this is still a very strong reading for the largest part of the U.S. economy.
- Yesterday, the U.S. announced that jobless claims hit a new pandemic low with 340,000 filed vs. an expectation of 350,000.
- Today, the U.S. released their August Employment Situation report and it was a huge disappointment, announcing a paltry increase of 235,000 nonfarm payrolls vs. a consensus expectation of 733,000. On the positive, the unemployment rate dropped to 5.2% from 5.4%, in line with expectations, and average hourly earnings increased 0.6% (0.3% expected) and now up 4.3% over the last year (3.9% expected). While the rate of increase in jobs was a disappointment, for investors fearing the Fed taper, 'substantial further progress' in the labor market may take longer to achieve than previously thought.
- Canada’s Q2 GDP surprised to the downside with a 0.3% drop, which was well below expectations of a 2.5% gain. The dip followed three consecutive quarterly increases and was the first drop since the sharp decline (11.3%) caused by pandemic-related business shutdowns and travel restrictions in the second quarter of 2020. When observed from a monthly perspective, GDP expanded 0.7% in June, following two consecutive monthly declines. Canada’s total economic activity is still 1.5% below February 2020's pre-pandemic level.
- Here is a link to a short video from Canaccord’s chief U.S. Strategist Tony Dwyer entitled Digging Deeper into Streaker Message: DWYER VLOG
- Also, this one-hour CNBC documentary is a very interesting watch: A race against Covid: How Moderna and Pfizer-BioNTech developed vaccines in record time
Weekly Diversion:
Check out this video of a cute kitten meeting a toy parrot.
Charts of the Week:
To expand on the payroll data point above by painting a bigger picture of the U.S. employment situation, here is a chart showing the monthly gains/losses since the start of 2019. One can see the huge miss this month. Despite the likely scrutiny on this number today, the report is not expected to have much of an impact on Fed tapering expectations which, in our view, still remains well down the road.


Source: Connected Wealth
Heading into the September long weekend, we would be remiss in overlooking that September is not one of the strongest months of the year. In fact, over the last 50-100 years it has been the weakest month historically, and over the last 20 years it is tied with June as the worst. In addition, September has historically been positive at best 50% of the time. This data does not mean that we will not see an eighth straight monthly gain (Feb-Sept) in the U.S. and Canadian equity markets, however, it is worthy of attention. Here is the data on the U.S. Dow Jones Industrial Average (DJIA) to illustrate this point:

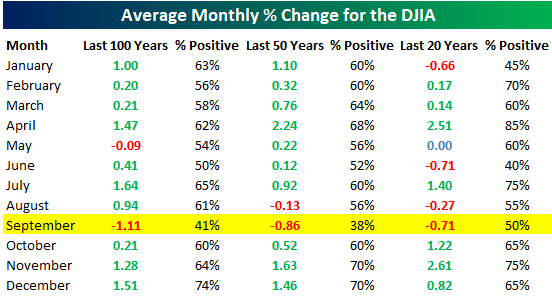

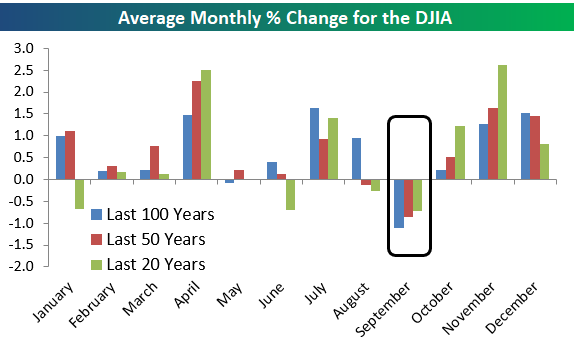
Source: Bespoke Investment Group
If one is looking for a silver lining here, it is the fact that when the S&P 500 is up over 10% heading into September, historically this has been a cushion to this potential “September” headwind. We refer to the fact that strength begets strength often, and this chart below illustrates that trend. In fact, depending on how markets perform through August, there is a wide array of possibilities. The green, blue, and red lines depict the path of September over the last 38 years when the market is up more than 10% year-to-date (YTD) as it is this year, up less than 10% YTD but still positive, and down YTD, respectively. In addition, the green line also comes with a positive rate of 54%, a slight advantage to the 20-year average.

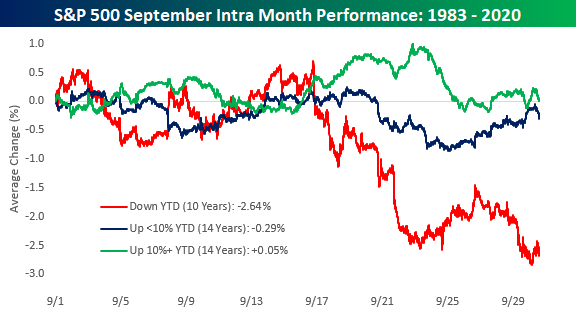
Source: Bespoke Investment Group
Sources: CNBC.com, Globe and Mail, Financial Post, BNN Bloomberg, Tony Dwyer, Canaccord Genuity, First Trust, Econoday, Connected Wealth, Bespoke Investment Group