Market Insights - The Day 100 Indicator & Small Business Pessimism
Milestone Wealth Management Ltd. - Jun 11, 2021
Macroeconomic and Market Developments: North American equity markets were mixed this week. In Canada, the S&P/TSX Composite increased by 0.50%. In the US, the Dow Jones Industrials dropped 0.79% and the S&P 500 Index was up 0.40%. Both the S&P/TSX
Macroeconomic and Market Developments:
- North American equity markets were mixed this week. In Canada, the S&P/TSX Composite increased by 0.50%. In the US, the Dow Jones Industrials dropped 0.79% and the S&P 500 Index was up 0.40%. Both the S&P/TSX Composite and the S&P 500 Index closed at all-time highs.
- The Canadian dollar was weaker, closing at 82.24 cents compared with 82.79 cents last Friday.
- Oil prices were strong again this week, with US WTI crude finishing at US$70.80 vs US$69.40 last week, and the Western Canadian Select price at ~$56.75 vs ~$54.90 last week.
- Gold prices were lower this week, closing at ~$1,877 compared with ~$1,892 last Friday.
- On Monday, EXFO (EXF) announced that it has entered into an agreement in which Germain Lamonde, founder and majority shareholder, will take the company private for US$6.00/share. This represents a 62% premium to where the shares were trading on the previous day. EXFO Inc provides technology solutions for wireless and wireline network operators across the telecom industry.
- Lightspeed POS (LSPD) announced it is to acquire Ecwid for ~$500M and NuORDER for ~$425M. Ecwid currently serves over 130,000 paying customers in over 100 countries around the world and NuORDER currently serves over 3,000 brands and saw more than 100,000 retailers make more than $11.5B in orders through its platform in the trailing twelve month period ended March 31, 2021.
- Pembina Pipeline (PPL) and Western Indigenous Pipeline Group (WIPG) have created a partnership called Chinook Pathways that is planning to form a 50-50 partnership to bid for the Trans Mountain Pipeline. Canada’s federal government bought Trans Mountain from Kinder Morgan Inc. for C$4.5 billion in 2018.
- The Bank of Canada gave its rate announcement on Wednesday, holding its benchmark rate at the effective lower bound of 0.25% and the Quantitative Easing (QE) program remains unchanged at $3 billion in weekly bond purchases as expected. The central bank added that economic developments in Canada have been in line with April's forecasts. GDP growth was 5.6% in Q1 despite the second wave of COVID-19.
- TC Energy (TRP), formerly TransCanada Pipeline, confirmed that after a comprehensive review of its options, and in consultation with its partner, the Government of Alberta, it has terminated the Keystone XL Pipeline Project. The announcement comes in response to U.S. President Joe Biden revoking the presidential permit for the controversial pipeline project as one of his first acts in office.
- US Inflation data was released on Thursday. Headline consumer prices rose 5.0% year-over-year in May, the fastest pace since August 2008 and higher than Wall Street expectations. Excluding food and energy prices, the 3.8% gain was the strongest since May 1992. Surging used car prices helped drive much of the inflation gains.
- Tourmaline Oil Corp (TOU) announced that it has entered into an agreement to acquire privately owned Black Swan Energy Ltd. for a total consideration of approximately C$1.1B, consisting of 26M Tourmaline common shares and the assumption of net debt up to a maximum of $350M.
- For a deeper dive, the US investment company First Trust has put out a US COVID-19 Tracker. Click here: COVID TRACKER
- In addition, First Trust has created a COVID Recovery Tracker. Click here: RECOVERY TRACKER
Weekly Diversion:
Check out this dog’s clever way to go for a swim.
Charts of the Week:
On May 26th, we hit the 100th trading day of the year, so we wanted to highlight the S&P 500’s return through that point and see if there is any pattern that we can gather from it. This is known as the Day 100 Indicator. As you can see from the chart below, this year the return number came in at 11.7%. In looking at all periods where the return through the 100th trading day was greater than 10%, you can see that bodes well for the rest of the year, with the average being 8.6% versus all other periods at 5.2%. In addition, if you look even more specifically at only the periods of 10-15% returns through the 100th day, the rest of year return is even better at approximately 11%, essentially double the average for all other years. Let us hope this pattern continues this year.


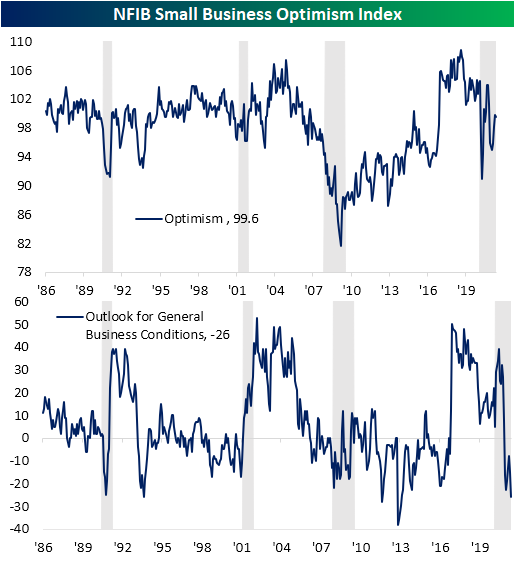
There was some positive news this week, including a few markets hitting new all-time highs. However, one economic data point for May that came in below expectations was the National Federation of Independent Business (NFIB) Small Business Optimism Index, a widely followed gauge of the overall health of the lifeblood of the US economy. The NFIB is the largest small business association in the US. This reading has certainly improved this year but remains well below pre-COVID levels. It appears that Wall Street is currently in a happier mood than Main Street. The current reading for May came in at 99.6 (first chart), roughly the middle of its historical range going back to 1986. However, one component of the index, the Outlook for General Business Conditions, is now down to a level that represents just the first percentile of all readings and the lowest since 2012. This component assesses expected business conditions over the next six months, so it is safe to say that small businesses are about as pessimistic as they have ever been in this respect. The third chart below depicts the spread between the first two readings. This spread between the small business optimism index and the outlook for general business conditions is now at its highest monthly level since at least 1986 (prior to 1986 the readings were quarterly). At first glance, one would think this may translate into poor forward-looking equity returns for Wall Street; however – surprisingly - the data points to the opposite.
In the fourth chart below, courtesy of the Bespoke Investment Group, they looked at all instances where the spread crossed above the 115 level for the first time in at least three months, as is the case this time. This occurred just recently back in January, so the six-month and one-year forward looking returns for that have yet to be determined. However, you can see in the seven prior instances that the one-month and three-month forward returns were way above average compared to all other periods, and the six prior instances where we have six-month and one-year data, those numbers were drastically above the norm with the six-month returns being three times higher than average and one-year returns were almost two times higher than average. In addition, if you look at the only occurrence where the spread was over 120 like today, back in 2012 the forward return numbers for that period were very strong, even higher than the average of this data group. Again, past data is no guarantee of future results, but this small set of data does not indicate that a high level of Main Street pessimism necessarily translates into an unhappy Wall Street.


Source for all: Bespoke Investment Group LLC, NFIB
Sources: CNBC.com, Globe and Mail, Financial Post, BNN Bloomberg, Tony Dwyer, Canaccord Genuity, LPL Research, FactSet, Bespoke Investment Group, NFIB