Market Insights: Interest Rates on the Rise
Milestone Wealth Management Ltd. - Feb 26, 2021
Macroeconomic and Market Developments: Equity markets in North America were down sharply this week. In the US, the Dow Industrials declined 1.78% and the S&P 500 was down 2.46%. In Canada, the S&P/TSX Composite dropped 1.76%. The Canadian dollar was
Macroeconomic and Market Developments:
- Equity markets in North America were down sharply this week. In the US, the Dow Industrials declined 1.78% and the S&P 500 was down 2.46%. In Canada, the S&P/TSX Composite dropped 1.76%.
- The Canadian dollar was volatile this week, at one point hitting the 80-cent mark, but finished well down on the week at 78.65 cents from 79.23 cents last Friday.
- Oil prices were up this week with US West Texas crude finishing at $61.65 vs $59.24 last Friday. The Canadian WCS price closed at ~$52.20 USD, up strongly from ~$47.92 last week for a 9% increase.
- Gold prices continued its downtrend this week, finishing at ~$1,729 from $1,781 last week.
- Last weekend, Pfizer (PFE-US) released a report that said its vaccine has been 89% effective in Israel in preventing transmission of COVID19. This is the first real world study, as Israel has been a world leader in the vaccination campaign.
- Canada-US relations were in the news this week with the Trudeau-Biden virtual summit on Tuesday. The meeting centered on renewed partnership, and included topics including combatting COVID-19, alliance on climate change and approach to China. With respect to China, Biden pledged US support in freeing the two Canadian Michaels that are still being held in China.
- Bank of Canada Governor Tiff Macklem spoke on Tuesday. His message was mostly dovish, stating that monetary policy will need to provide stimulus for a considerable period. He also stated that strength in the Canadian dollar could become a headwind to growth, but that an expected ramp-up in vaccination is boosting confidence in sustained strong growth into 2022.
- The major Canadian banks reported earnings this week, all of which beat estimates once again. On Tuesday, Bank of Montreal (BMO) reported Q1 earnings that beat expectations of C$3.06 ex-items vs average estimates of C$2.15 and Bank of Nova Scotia (BNS) also reported better than expected Q1 adjusted earnings of C$1.88 vs C$1.57 expectations. On Wednesday, National Bank (NA) reported better than expected Q1 earnings of C$2.15 ex-items vs estimates of C$1.71 and Royal Bank (RY) also beat estimates by posting earnings of C$2.66 vs estimates of C$2.28. On Thursday, CIBC (CM) beat estimates with earnings of C$3.58 ex-items vs C$2.81 estimates and TD Bank (TD) reported Q1 adjusted EPS of C$1.83 vs estimates of C$1.49.
- On Thursday, US Real GDP growth in Q4 was revised up to a 4.1% annual rate from a prior estimate of 4.0%, narrowly missing the consensus expected revision to 4.2%. Upward revisions to home building and inventories were slightly larger than a downward revision to consumer spending. The largest positive contributions to the real GDP growth rate in Q4 were consumer spending, home building, business investment in equipment, and inventories. The weakest component, by far, was net exports.
- Farmers Edge Inc., a Winnipeg-based agricultural technology provider which is controlled by Fairfax Financial Holdings Ltd, is boosting the size of its initial public offering to $125 million on the back of heavy investor demand. The company had originally hoped to raise $100 million but has increased the IPO size and priced the shares at $17 each, which is at the top end of expectations. The company will trade on the TSX under the symbol FDGE.
- The Alberta government released its 2021-22 budget on Thursday, projecting a budget deficit of $18.2 billion. The budget also predicts that the provincial debt load will reach a record $115.8 billion by the end of the fiscal year.
- Total global cases of COVID-19 finished this week at 113.3 million, with the total deaths at 2.51 million. In Canada, total cases now stand at 858,217, with active cases at 30,335. In Alberta, total cases are 132,432, with active cases of 4,484.
- For a deeper dive, the US investment company First Trust has put out a US COVID-19 Tracker. Click here: COVID TRACKER
Charts of the Week:
This week we need to discuss rising interest rates, as they really took off over the last couple weeks, causing some short-term turmoil with markets. With central bank overnight rates held down near the 0% mark likely for a long time still, we are only referring to longer-term rates which are determined by the marketplace. The increase in long-term yields vs the overnight rate at zero means that long-dated maturities are rising dramatically in comparison. In our industry we call this a steepening yield curve. What is important to note is that rising interest rates, or a steepening yield curve, are not a negative environment for equities as it indicates that the economic backdrop is becoming more positive and the credit market is predicting higher growth ahead. As long as the economy produces those results, equity markets tend to move higher. Of course, on the other hand, if the economy does not produce the anticipated growth the bond markets predict, you can land in some murky waters. We believe we are more in the former camp, where we will see continued strength from the real economy in the months ahead and equity earnings growth.
We made it clear in Q4 that if there was one theme we had the most conviction in, it was that we felt interest rates and inflation were inflecting higher in the first half of 2021. So far this has been the result, particularly with interest rates. When it comes to bonds, they have an inverse relationship with interest rates. When interest rates go up, the price of the bond you own will decrease. In addition, the longer maturity bond you own and the lower the coupon, the more sensitive it will be to that interest rate change. This can be seen by looking at the FTSE Canada Universe Bond Index (~70% government bonds) which is currently already down almost 5% YTD. To illustrate how difficult this can be for very long-term government bonds, the ICE U.S. Treasury 20+ Year Bond Index is down a whopping 12% YTD. Due to this dynamic, for some time now, our fixed income exposure has been focused more on shorter-term maturities and higher yielding corporate credit as opposed to government bonds, and even pockets of the fixed income market that tend to do well when rates rise like rate-reset preferred shares.
Let us first look at what we have seen recently compared to past spikes in interest rates. We put emphasis on the US 10-year treasury yield as it is probably the key proxy that market participants focus on. The grey line is the six-month change in US 10-year treasury yields and the purple line is the six-month percentage change. With rates recently rising rapidly from 0.7% last August to as high as 1.6% yesterday, that is more than a 100% increase in a short period of time. Although the absolute yield increase is not that high compared to past episodes (as rates are already so low), the percentage change today is the highest it has ever been in the past 40 years.


Source: Bloomberg, Connected Wealth
When we talk about yield curve steepening, many market participants look at the US 2-year and 10-year yields. Here is a chart showing the times when the yield curve has steepened by 75bps (0.75%) or more in six months. The last time this occurred like today was in 2013, and since 1977 there have only been 10 other instances.


Source: Bespoke Investment Group
As we mentioned above, rising interest rates, or a steepening of the yield curve, even when it occurs rapidly, is not a negative for equities as it indicates that the economy is growing and forecasted for faster growth ahead. Usually this is accompanied by rising commodity prices, another theme that is currently at play. The chart below shows this dynamic; that in past periods of rapidly rising rates, the forward returns for equities have been very positive on average when looking out 3-12 months, with the one-year median return being more than 50% higher than all periods since 1977. In the short-term, markets have tended to be more mixed with some near-term weakness as markets adjust to higher rates. You will note that the only two negative periods, in 2001 and 2007, we were either in a recession already, or just entering one. The current environment could not be further from that scenario where we have just exited a recession. As always, one cannot use a small sample size like this as any means to forecast future returns, it is merely for information purposes to see how markets have reacted in the past under a similar environment.

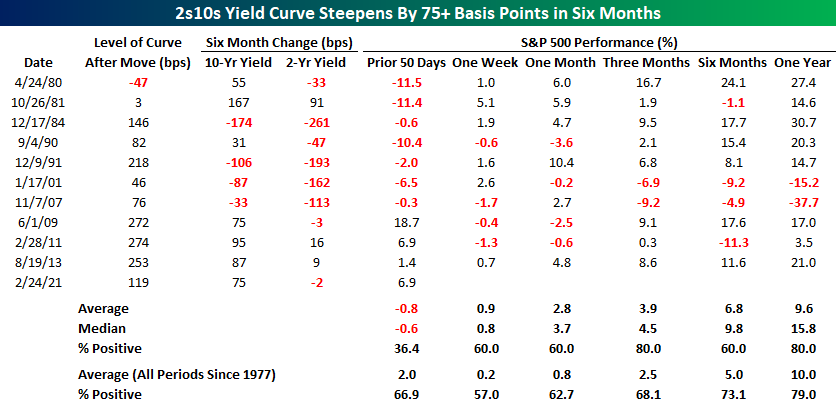
Source: Bespoke Investment Group
When we compare this to the dividend yield on equities, one would perhaps tend to think that when 10-year yields rise above the dividend yield of the equity market (S&P 500 in this case) it would result in poor performance for equities. The reasoning behind that would be theoretically stocks would be less attractive for investors when “risk free” rates have a higher yield. However, history has not shown that to be the case. Yesterday, we saw 10-year yields spike to 1.61%, above the S&P 500’s dividend yield of 1.43% (according to data from FactSet calculations based on payouts of the last 12 months).


Source: FactSet, CNBC
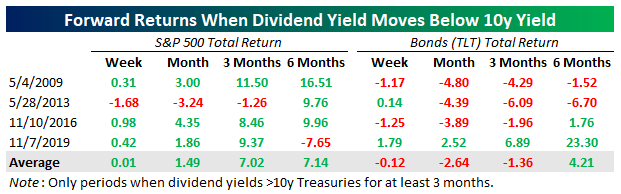
This could be a very short-term situation, or perhaps one that lasts longer. With the latter being more important, we found that there have only been four prior times since 2008 when the dividend yield on the S&P 500 moved below the 10-year treasury yield after being above it for at least three months. Prior to November 2008, the 10-year treasury yield had been higher than the dividend yield since the late 1950s. The red dots on the chart below show these crossing points since that change in 2009. Performance for the S&P 500 after these occurrences have been far from bearish with strong average returns one to six months later. The same cannot be said for long-term bonds, however, which have shown they typically continue to struggle, on average, especially over the next 1-3 months.


Source: Bespoke Investment Group
Where are 10-year treasury yields headed now? Based on the recent rise, which broke an important resistance line held over the past decade, there is reason to believe we could see it push closer to 2% sometime this year. As we have described, and as the charts above illustrate, this can still be a good environment for equities as long as we see continued economic and corporate earnings growth which is what this rising rate environment is forecasting.


Source: TradingView, @AlfCharts
Sources: CNBC.com, Globe and Mail, Financial Post, Government of Canada, Johns Hopkins University, oilprice.com, Canaccord Genuity, Tony Dwyer, The Logic, Bespoke Investment Group, Bloomberg, Connected Wealth, FactSet, @AlfCharts, TradingView