Market Insights: Stock Market Returns Under U.S. Presidents Over Time
Milestone Wealth Management Ltd. - Jan 22, 2021
Macroeconomic and Market Developments: North America stock markets were mixed this week. The Canadian TSX Composite index was down 0.35% and for the US, the Dow was up 0.59% and the S&P 500 was up 1.94%. The Canadian dollar was volatile this week,
Macroeconomic and Market Developments:
- North America stock markets were mixed this week. The Canadian TSX Composite index was down 0.35% and for the US, the Dow was up 0.59% and the S&P 500 was up 1.94%.
- The Canadian dollar was volatile this week, but in the end finished flat at 78.5 cents.
- Oil prices were mixed. The Western Canadian Select oil price was up this week, going from around $39 to around $40 this Friday. West Texas Intermediate crude finished flat at roughly $52.00.
- Gold recovered somewhat, closing at $1,859 vs $1,826 last Friday.
- Last Saturday, Alimentation Couche-Tard (ATD.b), owner of Circle K convenience stores, announced that it was abandoning its bid to buy Carrefour. Bloomberg reports that the decision to abandon negotiations came after top executives from Couche-Tard flew to Paris to offer the French government several sweeteners, however the package was not enough to persuade Finance Minister Bruno Le Maire, who told executives Friday he was standing by his position that a takeover would be bad for France.
- In economic news, Canada's wholesale trade grew by 0.7% in November, narrowly missing consensus of +0.9%. Also, Canada’s November manufacturing sales fell 0.6%, which was worse than the expected 0.2% contraction. And finally, Canada December housing starts came in at 228K vs consensus of 230K.
- Shares of General Motors (GM) hit an all time high on Tuesday after announcing that Microsoft (MSFT) was investing more than US $2 billion into GM’s self-driving car unit Cruise. Microsoft will also become the preferred cloud provider for GM and Cruise.
- On Wednesday, the Bank of Canada announced that it is holding its target for the overnight rate at the effective lower bound of 0.25%, with the Bank Rate at 0.50% and the deposit rate at 0.25%. The Canadian central bank will also continue its quantitative easing (QE) program at its current pace of at least $4 billion per week.
- US president Joe Biden used an executive order within hours of taking office on Wednesday to revoke the permit for the Keystone XL pipeline. Prime Minister Justin Trudeau said he is “disappointed”, Alberta Premier Jason Kenny said “this is a gut-punch for the Canadian and Alberta economies”, and TC Energy said it will review the decision and consider its options.
- Total global cases of COVID-19 finished this week at 98.0 million, with the total deaths at 2.10 million. In Canada, total cases now stand at 731,450, with active cases at 67,099. In Alberta, total cases are 119,114, with active cases of 10,256.
Charts of the Week:
Wednesday made it official for Joe Biden as he was sworn in as the 46th President of the United States. With that in mind, the table below summarizes the performance of the Dow Jones Industrial Average (DJIA) for every U.S. President since 1900. We are showing the DJIA because it has a longer history than the S&P 500. In terms of total percentages, the DJIA's 56.0% gain under Donald Trump's tenure ranked as the 8th best out of the 20 shown. While that performance seems middle of the road, all seven of the Presidents that oversaw larger gains did so over more than one full term. Therefore, to account for each President's time in office, in the rightmost column, you will see the DJIA's performance on an annualized basis, and in this case the 11.8% annual gain during the Trump administration ranks as the fourth-best behind only Coolidge (25.5%), Clinton (15.9%), and Obama (12.1%). As of this writing, and this may surprise many, since the November 2020 election, U.S. markets under Biden have outperformed the markets over the same period when Trump won in 2016 by a few percentage points.

Source: Bespoke Investment Group
The COVID-19 virus continues to be on everyone’s minds and there are definitely uncertainties remaining with supply issues and whether the current vaccines will be as effective against the various strains that have emerged. With that in mind, we thought we would share a recent positive stat coming out of the U.S., which shows that the hospitalizations seem to have peaked and are starting to trend down. The chart below shows the per capita hospitalizations over the course of the pandemic, with three clearly defined surges (many correctly anticipated a while ago that the third surge would be the worst). Although early, this is a positive sign. Tests remain high, new cases have dropped, and hospitalizations are dropping nationally. Thankfully, the recent surge appears to have peaked and the prior two precedents suggest declines will persist.
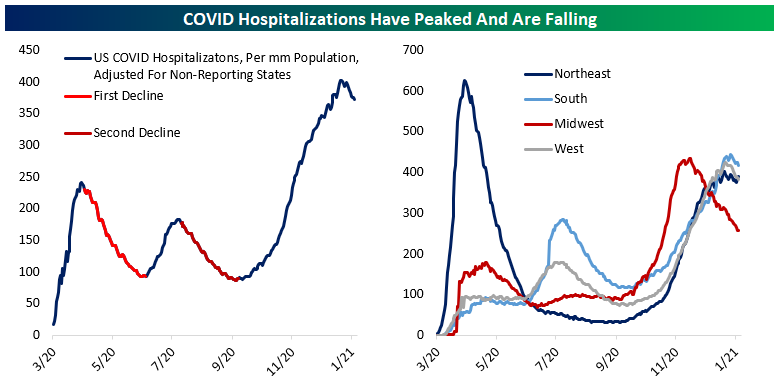
Source: Bespoke Investment Group
Sources: CNBC.com, Globe and Mail, Financial Post, Government of Canada, Government of Alberta, Johns Hopkins, oilprice.com, Canaccord Genuity, Tony Dwyer, Bespoke Investment Group