Market Insights: Third Quarter Wrap-up
Milestone Wealth Management Ltd. - Oct 11, 2019
Market Update North American equity markets were able to grind slightly higher again in the third quarter after similar results in the second quarter. On the other hand, international markets were mostly lower with emerging markets leading the downsi
Market Update
North American equity markets were able to grind slightly higher again in the third quarter after similar results in the second quarter. On the other hand, international markets were mostly lower with emerging markets leading the downside. Most of the gains so far this year occurred in the first four months, after a large correction at the end of 2018 resulting in negative calendar year returns for almost all equity markets around the world. In fact, since the end of April, the MSCI World Price Index (CAD) is down 1.5% to the end of September. It is still up 12% this year. That is mostly on the back of North America, as the MSCI EAFE Price Index (CAD) and the MSCI Emerging Markets Price Index (CAD) are down 3.2% and 8.7% respectively since April, and year-to-date returns are much less substantial than domestic returns as you can see in our Milestone Quarterly Market Report at the end of this commentary. The last two quarters have had their fair share of volatility, however, with two drawdowns of over 5% in May and August. Suffice to say, it has been mostly trendless here since April, with volatility around the 50-day moving averages for the S&P/TSX Composite and the S&P 500.
The first quarter recovery this year was a good sign and has maintained the long-term uptrend for most equity markets; however, over this entire period it has been a fairly difficult time for equities. Looking at US markets, the S&P 500 price index peaked at 2873 in January of 2018 and closed this past quarter at 2977. That said, just here in October, it has dipped down briefly below 2873, leaving it essentially flat. Canadian markets are similar, with the S&P/TSX Composite peaking at 16,413 on a closing basis in January 2018 and closing this past quarter at 16,659. However, at the time of this writing, it is actually lower than 16,413. Again, no price progress, which goes to show that in trendless markets, dividends are an essential component of total returns and an important part of our portfolios.
Fixed income markets, on the other hand, continue to perform admirably due to the compression of long-term interest rates. The inverse relationship of interest rates and bond prices has resulted in the FTSE TMX Canadian Bond Universe Index rising 7.8% this year. The vast majority of this return has come from government bonds with maturities of over 10 years. We discussed this at length in our Second Quarter Wrap-up, commenting on these returns vs. managing portfolios. We continue to hold our fixed income allocation with a much lower overall duration than the benchmark, preferring to reduce the current high interest rate risk where rates are at a level that may turn out to be near secular lows.
In other markets, the price of Gold and WTI Crude Oil have increased 15% and 19% respectively year-to-date in US dollars. We witnessed a big spike in oil prices in mid-September, with the price of WTI Crude rising from about $55USD/barrel to as high as almost $65 the following trading day. This $10 price spike, a result of the Saudi Arabia drone strikes on September 14th, did not last long, however, with the price falling thereafter lower than where it was prior to the strikes by month-end. The initial reaction was due to the strikes temporarily knocking out 5% of the world's oil supply. The supply fears seem to have been alleviated since then with the long-term consequences of the strike not as severe as originally thought.
The Canadian dollar remains mostly range-bound since January, closing the quarter at 75.5 cents to the US dollar (Loonie up 3% YTD), which is almost the same as its 50-day moving average.
Milestone strategy and outlook
We continue to focus on our long-term fundamental core thesis, which in our view remains positive. Please revisit past commentaries for more details on the fundamental drivers behind this core thesis, which we also discuss later in this report when discussing the Federal Reserve. Although corporate earnings growth this year has been poor the last two quarters and overall economic growth has been slow (albeit still positive), there is some evidence that both could be on the verge of reaccelerating. Importantly though, credit remains in great shape despite the recession fears out there. There simply hasn't been any meaningful deterioration in the credit markets that typically takes place well ahead of such a feared economic retrenchment and subsequent bear market.
How do we know this? Firstly, the Chicago Fed National Financial Conditions Sub-Indices that measures over 100 credit stress indicators in the banking and financial markets currently shows no sign of stress. Second, the high yield debt index is at or near a record high, as represented by the Barclay's US Corporate High Yield Total Return Index. This suggests there aren't any red flags in the riskier areas of US corporate credit. And lastly, the average Moody's BAA Yield is not far off its recent record low of under 3%. The BAA credit rating is the lowest quality (riskiest) end of investment grade corporate debt, so the current data doesn't suggest that the current flight to quality in US Treasuries is spilling over to investment-grade debt.
There is still much hype about the inverted yield curve. To be clear, the inversion of the yield should be a pause for concern, but as we have discussed in past commentaries, it can't be looked at in isolation. The core part of the yield curve, the 10- to 2-year Treasury yield spread, did invert for a short period of time from late August to early September and did close the month of August in negative territory. It has since moved back to positive territory. We look at the 10- to 2-year spread and the 30-year to 3-month spread as the most important. The latter also inverted for a few days during the same period but is now also back in positive territory. In fact, the spread is back to +0.45% which reduces our concern level. We would prefer to see this stay negative for a more sustained period than just ten days to consider this a true inversion, yet it is not to be ignored.
What we do know is that in the event of a yield curve inversion (even if you consider this very short time frame a true inversion), as we have shown in past missives, history shows that recessions tend to start a median of 19 months after an initial UST 10/2y yield curve inversion, suggesting no recession in sight. This also applies to past peaks in the S&P 500, with inversions occurring a median 18.5 months prior to the peak with a further median gain of 21%. This is even greater in the last three cycles, where the median lead time to equity market peak has been 21 months with further gains of 25%, 34% and 40%. Therefore, in the past this has been a long leading indicator, and not necessarily a good short-term de-risking tool in terms of managing a long-term investment portfolio.
When looking at markets and equity levels and where they may go in the future, many tend to make the mistake of looking at where we stand in the present. In other words, are things good or bad now, and if it is bad, I shouldn't own risky assets. However, this is not the correct way of looking at how markets move. In reality, the stock market is one of the best leading indicators there is. It is best said by market strategist Jeff Saut: "The market doesn’t care about the absolutes of ‘good’ or ‘bad’, it cares whether things are expected to get better or worse". We can't stress enough that it perhaps one of the most important concepts to understand when it comes to figuring out the market. Through our lens, we are in the ‘things are getting better’ camp at this point in time, and we believe we could be near the end of a third mini-recession marketplace, with lows in the S&P 500 leading to lows in the 10-year US Treasury Bond yield.

SOURCE: Bloomberg Finance L.P./Canaccord Genuity Corp.
We have already seen the CITI Economic Surprise Index bottom and start to climb back into positive territory. The index itself should not be used as a leading indicator of future equity performance as it, by nature, is a mean reverting index. However, when it has emerged from prolonged stretches in negative territory into positive, it has usually been a good sign. The chart below shows the index going back to 2003 and the red sections indicate where the index was negative for at least 100 trading days. The most recent negative period of 140 trading days was one of the longest. This essentially means that after a long period of negative data, economists have finally ratcheted down estimates enough to be in line with actual conditions. Again, as we stated above, it is not the absolute level of where we are that is necessarily important (our current level is based on history), it is whether things are getting better or worse.

Source: Citigroup/Bespoke Investment Group LLC
Further to this, Bespoke Investment Group has their own Economic Indicator Diffusion Index. It too has just recently pulled back into positive territory after a very long negative period. It reverts back and forth above and below zero, however, it has been consistently below zero for almost the entirety of the last year. The latest streak of negative readings below zero of 159 trading days, which ended the second week of September, is the longest on record for this index going back to 1999. This is just the sixth time the reading has been below zero for over 80 trading days and the third time over 100 days. As you can see from the data chart below, the performance of the S&P 500 following lengthy negative streaks has been quite good, with the average six and twelve month return being 9.3% and 13.3% respectively (median: 8.2% and 9.2%), and positive in all cases except one.
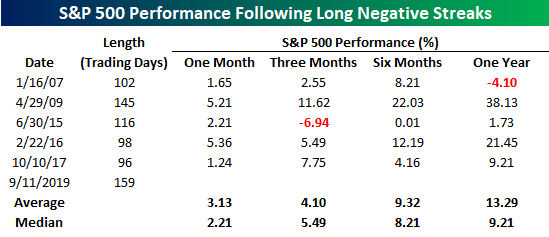
Source: Bespoke Investment Group LLC
The US Federal Reserve recently began the most recent easing cycle and has lowered the Fed Funds Rate twice (two 0.25% rate cuts). We expect one more decrease this year, possibly as early as the next meeting on October 30th. The Bank of Canada may follow their lead this time. At the time of this writing, the Fed Funds Futures are forecasting a 79% chance of a rate cut at the end of October and 89% chance of at least one rate cut by the end of the year. We have learned in the past not to fight the Fed as it is an important part of the fundamental drivers of markets and the economy. Inflation and inflation expectations drive Fed policy, and in turn, Fed policy drives the yield curve. The recent flat yield curve has clearly indicated that the Fed has not been accommodative enough. It is essential for the Fed to follow the inflation indicators and cut rates, given the lower inflation backdrop and mixed data, and they are doing so. This is important because the steepness of the yield curve and the availability of money is what drives the economy, which in turn drives operating earnings per share (EPS) and the equity market. The continued positive trajectory of EPS and low inflation should affect a continued price multiple expansion towards 19X. This is the historical average PE ratio for US equities when inflation remains in the range of 1-3%.
In addition, the history of a second Fed cut suggests leaning more towards offense than defense. The last Fed rate cut on September 18th represented the 15th post-WW2 easing cycle, as defined by two or more cuts prior to a hike. As you can see in the following chart, the median 6- and 12-month gains in prior instances for the S&P 500 were 11.1% and 18.3% respectively. It is quite evident that the last two cycles (2001 and 2007) were followed by very poor markets, however, those were periods with very different credit market backdrops than today. If we look at the three non-recessionary time periods like the present (1971, 1995, 1998), the median gains were 8.2% and 18.7% over the next six and twelve months.
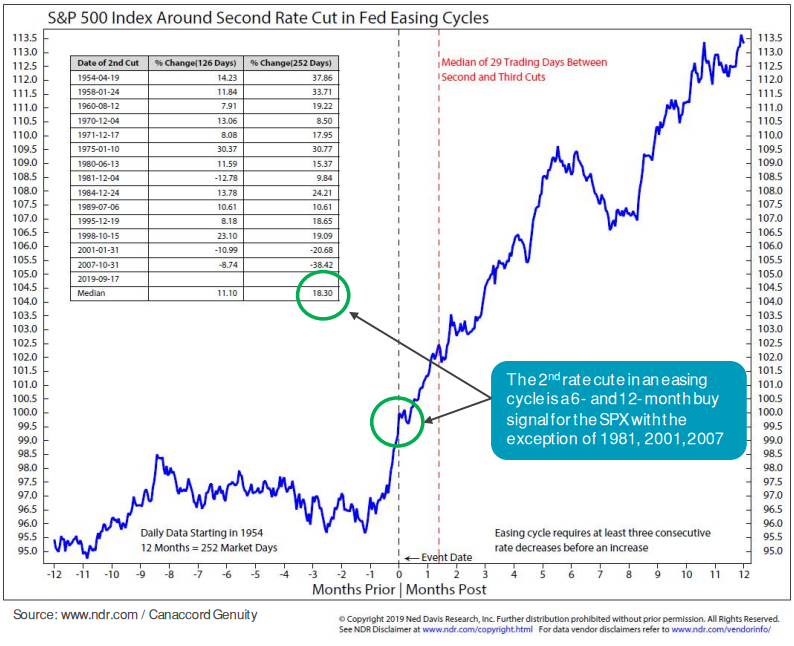
Source: Ned Davis Research Inc./Canaccord Genuity Corp.
We will finish off this quarter's comments with a continuation of our comment above that we may be emerging from the third 'mini recession' of the secular bull market that we have been in since 2009. To summarize, there have been three separate periods of global manufacturing weakness that have caused fear of oncoming recession for the US. The first was the 2011-12 European Debt Crisis, the second was the 2015-2016 Asian Commodity Crisis and now third the 2018-19 China-US Trade Crisis. The most recent period has exhibited similar slower global growth led by weakness in manufacturing. The S&P 500 hit its low last December and rose over 20% since to the recent 10-year Treasury yield low on September 3rd. If this pattern continues, we should see further strength for equity markets and renewed weakness for long-term bond markets.
To conclude, despite fears of slow global growth, a trade war, and a flat yield curve, the positive influences that drive our fundamental core thesis are still present today. That said, risks have risen with some macro-economic data indicating further slowdown. In order to determine the extent of these risks, we continue to focus on the health of credit markets and the flow of capital. We have yet to see any major cracks in the credit market, which remains robust, and the flow of capital remains positive. We also know that the Fed is focused on a soft landing for their economy and will use all the tools at their disposal, which we have seen time and time again this cycle act as an important tailwind for equities. Our Milestone Recession Risk Composite™ is currently at a 7.0/10 level, indicating a moderately low level of U.S. recession risk on the horizon. We continue to monitor this closely as it drives our overall asset allocation.
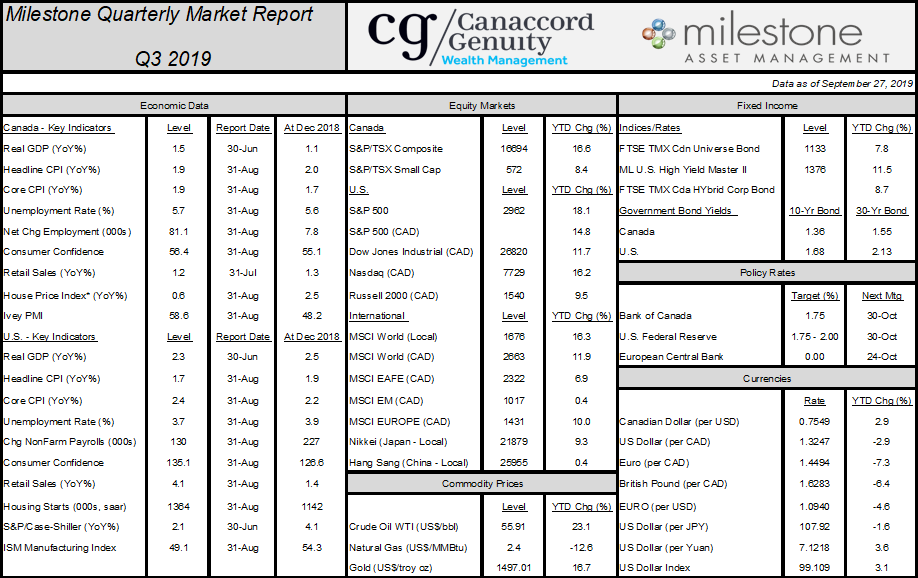
Here is our Milestone Market Report on economic data, capital markets, commodities and currencies through September 27th, 2019: (click image for PDF version)