Market Insights: First Quarter Wrap-up
Milestone Wealth Management Ltd. - Apr 16, 2019
Market Update Global equities rallied sharply in Q1 with the S&P 500 posting its biggest quarterly gain since 2009 and its best start to the year since 1998. Even with that great start, however, markets remain slightly below their peak left behind in
Market Update
Global equities rallied sharply in Q1 with the S&P 500 posting its biggest quarterly gain since 2009 and its best start to the year since 1998. Even with that great start, however, markets remain slightly below their peak left behind in Q3 of 2018 after the harsh correction that occurred in Q4, the largest quarterly decline since Q3 of 2011. The S&P 500 and the S&P/TSX Composite both still need to rise another three percent or so to surpass their all-time price highs. We expect that both will rise to new highs at some point this quarter and then likely consolidate for a period of time. This belief stems from strong underlying breadth to the market on this upward push we have witnessed. International equity markets have also been strong so far this year, led by China and other emerging markets.
Bond prices have rallied as well, with the yield on 10-year treasuries in the U.S. falling by more than 0.25% and Canada's 10-year government bond yield dropping 0.35%. This has been a bit of a surprise to us, but it's likely due to slowing global growth. Time will tell, but this may be overdone, however, as we are starting to see some improvement with economic growth, especially with U.S. GDP growth likely to surpass expectations in Q1 according to our estimates.
The Loonie rose 2.2% against the U.S. dollar this quarter. However, this is after a 7.8% decline last year, and really hasn't done much to reverse the trend of a weak currency for Canada. We don't see any alarming amount of downside for our currency, but we also don't see a lot of upside. Domestic growth here (1.1% year-over-year GDP growth) is at a crawl compared to the U.S. (3%). The longer-term downtrend of our currency to the greenback since 2011 is well intact.
Lastly, we witnessed a very large jump in oil prices so far this year, with WTI crude jumping 30% to finish the quarter just above US$60. This is the largest quarterly increase in almost a decade; however, it follows a 35% decline in the fourth quarter of last year. It is our expectation for prices to remain in the $60-$70 range for most of this year. Canadian energy companies remain undervalued to the U.S. counterparts, so it would be a positive to see an improvement in that respect. We have commented in past missives that the lack of confidence from foreign investors in the Canadian economy has surely been a detriment to our stock market and valuations. We are hopeful for change.
Milestone strategy and outlook
We stated quite firmly in our last Q4 commentary in January that we felt the collapse in December was event-driven (Fed policy mistake), and not indicative of the longer-term uptrend which we continued to believe was still intact. In fact, we believe there is a strong likelihood that we witnessed the third cycle reset within the longer-term secular bull market we have been in since 2009 and see more upside from here. The first two being in 2011 and 2015/16. We also feel we are still within the second leg of what will likely be three legs to the secular bull. In past cycles, the second leg is usually the strongest.
There were many factors at play for the recent rally, however, the most influential has likely been the dovish pivot on the part of the Fed. We discussed this in our last comments, and it was the basis of our belief that the correction was very much event-driven, and likely to reverse course in 2019. We will admit, however, we are a bit surprised at how quickly markets have recovered. In addition, our Milestone Recession Risk™ (MRR) Composite did not move below 5.5/10 at its worst point through the correction. A flashing red signal for us is not triggered until this dips below 5. We view this as an ongoing positive, as the composite also stayed at 5 or above during the last cycle reset in 2015/16, adding further confidence in our composite for not providing false sell signals.
Another factor at play as a tailwind for this rally has been the continued pickup in expectations for a trade deal between the U.S. and China. In addition, after five straight quarters of double-digit corporate earnings growth in the U.S. stemming from favorable corporate tax cuts last year, there was a low bar being set for Q1 corporate earnings expectations. We feel earnings will likely surprise to the upside, and that the cited earnings recession could be misstated. We continue to see companies repurchase shares at an aggressive clip, providing some further support for markets.
The yield curve in the U.S. and Canada continued its flattening trend with the spread between 3-month bill and ten-year notes inverting for the first time since 2007. The media has really grasped on to that of late, with prognostications of impending recession. From our lens, we don't see any indication of U.S. recession risk at the current time. Firstly, we focus mainly on 2-year and 10-year yields as well as 3-month and 30-year yields, neither of which have inverted yet. We have discussed yield inversions in the past as a long leading indicator. Typically, markets perform very well for 18 months on average after an inversion, so de-risking on an inversion is not necessarily a good investment strategy regardless, contrary to the negative media prognosticators who continue to underestimate this cycle. That being said, the yield curve is certainly very important, and it forms part of our MRR Composite, so it is something we continue to monitor.
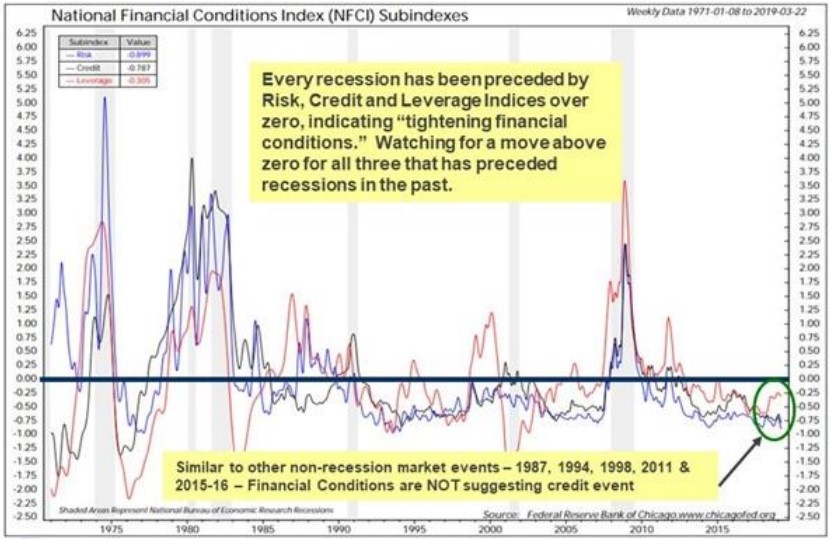
One of the key factors we look at in terms of overall market health are credit markets. One of the key reasons for remaining positive through the correction at the end of 2018 was the fact that we saw very little overall stress on credit markets. Despite the economic fear associated with the recent inversion of a portion of the yield curve, we believe the credit backdrop remains sound as evidenced by new cycle lows in two of the three Chicago Fed National Financial Conditions Sub-Indices. In our view, this is a very important data series that includes 105 credit stress indicators in banking, shadow banking and the financial markets (see chart below). It is our belief that we would see a real credit problem showing up if recession risk was high, and to this point we are just not seeing that.
In our opening paragraph, we stated that markets will likely rise to new highs this quarter and hold there due to the underlying breadth of the market. We will finish off our comments this quarter by elaborating on what we mean by that. We continue to see new highs in the cumulative NYSE Advance-Decline (AD) lines. To see more explanation on this, please review our comments called Retest? that we posted back in late January. It was one of the key reasons we felt we would not get a retest of the low we witnessed in December, and that further upside was ahead, due to a positive divergence with this breath indicator versus stock market prices. This proved out well, and we still see upside with this indicator hitting new highs last week. It is not just the NYSE, as the Dow's AD line has also hit a new high. Another encouraging sign is that we are finally starting to see financials perform well, which is important for the overall market. We continue to see broad strength underlying the market, but it is our expectation for markets to have a period of consolidation here that could last for quite some time. However, we don't currently expect any significant pullback (+10%), but a ~5% move back down to the range of the markets 50 and 200-day moving averages would not be a shock.
As always, we continue to monitor our long-term leading indicators for recession risk, as well as some of the near-term risks such as a collapse in US-China trade talks, corporate earnings growth and Fed policy communication. However, we remain positive in our longer-term outlook based on the core drivers that we still see in place today.
Here is our Milestone Market Report on economic data, capital markets, commodities and currencies through March 29th, 2019: (click image for PDF version)
